
Home >Backend Development >C++ >Create a cyclic graph using Networkx in Python
Create a cyclic graph using Networkx in Python

- WBOYWBOYWBOYWBOYWBOYWBOYWBOYWBOYWBOYWBOYWBOYWBOYWBforward
- 2023-09-06 14:01:051076browse
A cyclic graph is a special kind of graph in which each node has exactly two neighbors and is connected to other nodes in a complete cycle. Make cycle diagrams quickly and easily using Python's Networkx module. The cycle graph is generated by using the "networkx.cycle_graph()" function and the number of nodes. This diagram is frequently used in a variety of applications, including the modeling of periodic phenomena, the representation of circular structures, and the analysis of cyclic processes. It is useful in graph theory and many real-world applications due to its ease of use and ability to represent cyclic interactions.
What is NetworkX in Python?
A powerful Python package called NetworkX for designing, inspecting, and manipulating complex networks or graphs. It provides a variety of tools and techniques to efficiently handle graph structures. Developers and academics can use NetworkX to quickly model interactions between projects, examine network characteristics, pinpoint important nodes, locate shortest paths, and more. Because of their adaptability, libraries are important resources in many fields, including social network analysis, transportation networks, biology, and Internet technology. Python programmers can take advantage of NetworkX's user-friendly interface and extensive functionality to solve challenging graph-related problems and learn more about data interconnections.
Cycle diagram
A cyclic graph is a special kind of graph in which each node is connected to exactly two of its neighbors, forming a single closed loop or loop. There are no branches or large connections between the nodes in this graph. This loop creates a circular structure that serves as the defining feature of loop diagrams. This is a basic idea in graph theory and is often used to model cyclic or periodic events. Cyclic diagrams are used in a variety of disciplines, such as chemistry, physics, computer science, and social network research, where cyclic interactions and patterns need to be displayed and analyzed.
Attributes
Every node in a loop graph is connected to exactly two other nodes, creating a closed loop without any branches or dead ends.
The symbol for a cyclic graph with n nodes is C_n, where n represents the total number of nodes in the cycle.
A cyclic graph with n nodes has exactly n edges, since each node is connected to its two adjacent neighbors by an edge.
The dimension of the cycle graph C_n is floor(n/2). It represents the maximum possible separation between any two graph nodes.
A cyclic graph has two vertex connections and two edge connections, so deleting one of the two will not cause the graph to be disconnected.
Cyclic graphs have closed walks that pass exactly through every edge because they are Eulerian graphs.
There is a Hamilton cycle in every cycle graph C_n, or a cycle that visits each node exactly once.
Cyclic graphs can be represented on a 2D plane without containing any edge intersections because they are planar graphs.
Cyclic graphs have rotational symmetry because they retain their appearance after being rotated by any multiple of 360 degrees.
If n is an even number, the chromatic number of the cycle graph is 2, and if n is an odd number, it is 3.
Cyclic graphs are useful in many applications and can serve as building blocks in more complex graph structures due to their simple and well-defined functionality.
usage instructions
Import module
Display diagram
Import module
When building cycle graphs in Python using Networkx, the term "import module" refers to providing the required libraries in the script to support the manipulation and visualization of the graph. The 'networkx' module specifically provides tools for creating, analyzing and formulating graphs, while the optional 'matplotlib.pyplot' module supports graph visualization. By importing these modules, we can more easily build cycle diagrams, analyze their properties, and use visualization techniques to learn more about the structure and relationships of the diagram. This improves our understanding of cyclic patterns and processes in a variety of real-world applications.
algorithm
nx import "networkx"
You can import "matplotlib.pyplot" as plt to view the graph.
To generate a cycle graph, use Networkx’s Cycle_graph() method.
The cycle_graph() function accepts input num_nodes, which represents the total number of nodes.
The generated cycle graph object should then be assigned to a variable (such as cycle_graph).
If visualization is required, create a layout that allows the nodes to be displayed in a beautiful way (for example, pos = nx.circular_layout(cycle_graph)).
Use the nx.draw() function to draw graphics based on the given information and layout.
If you want a better visual representation, set parameters for node labels, colors and text sizes.
To view a cycle plot, use plt.show() to display the graphical plot (assuming matplotlib is imported).
Add required libraries:
Create a cycle graph object:
Graphic visualization (optional):
Return the cycle graph object.
grammar
import networkx as nx
import matplotlib.pyplot as plt

def create_cycle_graph(num_nodes):
   cycle_graph = nx.cycle_graph(num_nodes)
   return cycle_graph

def visualize_graph(graph):
   pos = nx.circular_layout(graph)
   nx.draw(graph, pos, with_labels=True, node_size=1000, node_color='skyblue',
font_size=10)
   plt.show()

if __name__ == "__main__":
   num_nodes = 5
   cycle_graph = create_cycle_graph(num_nodes)
   visualize_graph(cycle_graph)
Output
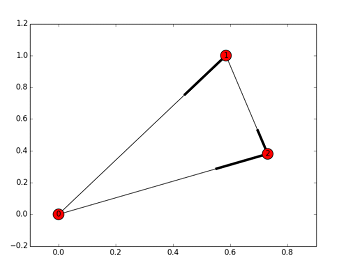
Display image
"Display a graph" refers to the process of displaying a graphical visualization on the screen when building and visualizing a cycle graph using Networkx in Python. Use the "nx.draw()" function to represent the cycle plot graphically, and then use the "plt.show()" command to display the plot in an interactive window (where "plt" is "matplotlib.pyplot"). The user can then view the cycle graph with its cycle structure, node connections, and any other relevant data. The properties and interactions of cyclic diagrams can be more easily understood and analyzed by using the diagram shown as its visual representation.
algorithm
In order to generate and visualize graphs, import the Networkx and Matplotlib libraries.
You can use user input or predefine a certain number of nodes for the cycle graph.
To construct a Cycle Graph object with the desired number of nodes, use the nx.cycle_graph() function.
To change the appearance of the graph, use the nx.draw() function with optional parameters.
To display graphics on the screen, use plt.show().
Example
import networkx as nx
import matplotlib.pyplot as plt

num_nodes = int(input("Enter the number of nodes for the Cycle Graph: "))

cycle_graph = nx.cycle_graph(num_nodes)


pos = nx.circular_layout(cycle_graph)
nx.draw(cycle_graph, pos, with_labels=True, node_size=1000,
node_color='skyblue', font_size=10)

plt.show()
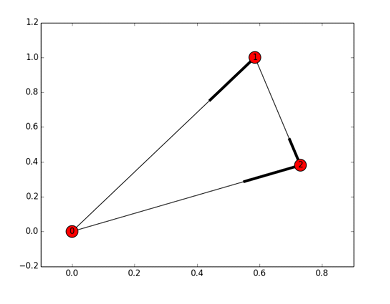
Output
in conclusion
Finally, using Python's Networkx, we were able to correctly generate and display the cycle diagram. Each node in the cycle graph is connected to exactly two neighbors to indicate a closed loop. With the help of Networkx's powerful graph working tools, we can model and analyze a variety of real-world cyclic relationship-related events. Python programmers can examine complex network structures, locate important nodes, find shortest paths, and more by using Networkx's user-friendly interface and rich functionality. Networkx is a useful tool in graph theory and various applied disciplines, as the visualization capabilities of graphs help to better understand cyclic patterns and interconnections.
The above is the detailed content of Create a cyclic graph using Networkx in Python. For more information, please follow other related articles on the PHP Chinese website!