


In this two-part series, we'll combine the versatile canvas element and the powerful jQuery library to create a bar chart plugin. In part two, we'll convert it into a jQuery plugin and then add some eye candy and other functionality.
EndThe Joy of CanvasA two-part series, today we will create a bar chart plugin; please note that this is no ordinary plugin. We'll demonstrate jQuery's love for the canvas element to create a very powerful plugin.
In the first part, we only focused on implementing the plugin's logic as a standalone script. At the end of the first part, our bar chart looks like this.
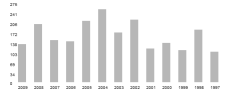
Results at the end of Part 1
In this final part we will work on converting our code and making it a proper jQuery plugin, adding some visual details and finally including some additional functionality. Ultimately, our output will look like this:

Finished product
Are you all warmed up? let's start!
Plug-in Procedure
Before we start converting code into plug-ins, we first need to understand some procedures for plug-in creation.
Naming plugin
We start by choosing a name for the plugin. I selected barGraph and renamed the JavaScript file to jquery.barGraph.js. Now, we include all the code from the previous article in the following code snippet.
$.fn.barGraph = function(settings) {
//code here
}
Settings Contains all optional parameters passed to the plugin.
Solution to $ symbol problem
In jQuery plugin authoring, it is common to consider using jQuery instead of $ aliases in your code to minimize conflicts with other Javascript libraries. Instead of going through all this trouble, we can use custom aliases as mentioned in the jQuery documentation. We wrap all the plugin code in this self-executing anonymous function like this:
(function($) {
$.fn.barGraph = function(settings) {
//plugin implementation code here
}
})(jQuery);
Essentially, we wrap all the code in a function and pass jQuery to it. Now, we can use the $ alias freely in our code without worrying about it potentially conflicting with other JavaScript libraries.
default value
When designing a plugin, it is best to expose a reasonable number of settings to the user, while also using reasonable default options if the user uses the plugin without passing them any options. With this in mind, we will allow the user to change each of the graphics options variables I mentioned in the previous article in this series. Doing this is easy; we just define each variable as a property of the object and then access them.
var defaults = {
	         barSpacing = 20,
	 		 barWidth = 20,
	    	 cvHeight = 220,
			 numYlabels = 8,
			 xOffset = 20,
			 maxVal,
			 gWidth=550,
			 gHeight=200;
           };
We eventually need to merge the default options with the passed options and give priority to the passed options. This line handles this problem.
var option = $.extend(defaults, settings);
Remember to change variable names if necessary. like -
return (param*barWidth)+((param+1)*barSpacing)+xOffset;
...change to:
return (param*option.barWidth)+((param+1)*option.barSpacing)+option.xOffset;
Reconstruction
This is where the plugin is finalized. Our old implementation could only generate a single graphic in a page, and the ability to create multiple graphics in a page was the main reason we created a plugin for this functionality. Additionally, we need to ensure that users do not need to create a canvas element for each chart they want to create. With this in mind, we'll dynamically create canvas elements as needed. Let's get on with it. We'll look at earlier and more recent versions of the relevant parts of the code.
Calling plug-in
Before we start, I want to point out how our plugin will be called.
$("#years").barGraph
   ({
		 barSpacing = 30,
        barWidth = 25,
		 numYlabels = 12,
   });
It's that simple. years is the ID of the table that holds all our values. We pass options as needed.
Get data source
First, we first need to reference the data source of the chart. We now access the source element and get its ID. Add the following lines to the set of graphics variables we declared earlier.
var dataSource = $(this).attr("id");
We define a new variable and assign to it the value of the ID attribute of the passed element. In our code, this refers to the currently selected DOM element. In our example, it refers to the table with ID years.
In the previous implementation, the ID of the data source was hard-coded. Now we replace it with the ID attribute we extracted earlier. grabValues An early version of the function is as follows:
function grabValues ()
	 {
	 	// Access the required table cell, extract and add its value to the values array.
		 $("#data tr td:nth-child(2)").each(function(){
		 gValues.push($(this).text());
	 	 });

		 // Access the required table cell, extract and add its value to the xLabels array.
		 $("#data tr td:nth-child(1)").each(function(){
	 	xLabels.push($(this).text());
	 	 });
	 }
Updated to:
function grabValues ()
	 {
     	// Access the required table cell, extract and add its value to the values array.
	 	$("#"+dataSource+" tr td:nth-child(2)").each(function(){
		 gValues.push($(this).text());
	 	 });

		 // Access the required table cell, extract and add its value to the xLabels array.
		 $("#"+dataSource+" tr td:nth-child(1)").each(function(){
	 	xLabels.push($(this).text());
	 	 });
	 }
注入 Canvas 元素
function initCanvas ()
	 {
		 $("#"+dataSource).after("<canvas id=\"bargraph-"+dataSource+"\" class=\"barGraph\"> </canvas>");

         // Try to access the canvas element
     	cv = $("#bargraph-"+dataSource).get(0);

	 	if (!cv.getContext)
	 	{ return; }

     	// Try to get a 2D context for the canvas and throw an error if unable to
     	ctx = cv.getContext('2d');
	 	if (!ctx)
	 	{ return; }
	 }
我们创建一个canvas元素并将其注入到表格之后的DOM中,该表格充当数据源。 jQuery 的 after 函数在这里非常方便。还应用了 barGraph 的类属性和 barGraph-dataSourceID 格式的 ID 属性,以使用户能够根据需要将它们全部设置为组或单独设置样式。 p>
循环传递的元素
有两种方法可以实际调用此插件。您可以单独创建每个图表并仅传入一个数据源,也可以传入多个数据源。在后一种情况下,我们当前的构造将遇到错误并退出。为了纠正这个问题,我们使用 each 构造来迭代传递的元素集。
(function($){
	$.fn.barGraph = function(settings) {

	// Option variables
	var defaults = {
	         // options here
           };

	// Merge the passed parameters with the defaults
    var option = $.extend(defaults, settings);

	// Cycle through each passed object
	this.each(function() {

	// Implementation code here
	});

	// Returns the jQuery object to allow for chainability.
	return this;
	}
})(jQuery);
我们在获取并合并 this.each 构造中的设置后封装了所有代码。我们还确保最后返回 jQuery 对象以实现可链接性。
至此,我们的重构就完成了。我们应该能够调用我们的插件并根据需要创建尽可能多的图表。
添加养眼效果
现在我们的转换已经完成,我们可以努力使其视觉效果更好。我们将在这里做很多事情。我们将分别研究它们。
主题
旧版本使用温和的灰色来绘制图表。我们现在将为酒吧实施主题机制。这本身由一系列步骤组成。
海洋:默认主题

树叶

樱花

频谱
将其添加到选项
var defaults = {
             // Other defaults here
	 	 	 theme: "Ocean",
           };
我们在默认设置中添加了一个主题选项,使用户能够将主题更改为四个可用预设中的任何一个。
设置当前选择的主题
function grabValues ()
	 {
	 	// Previous code

		switch(option.theme)
		{
			case 'Ocean':
			gTheme = thBlue;
			break;
			case 'Foliage':
			gTheme = thGreen;
			break;
			case 'Cherry Blossom':
			gTheme = thPink;
			break;
			case 'Spectrum':
			gTheme = thAssorted;
			break;
		}
	 }
一个简单的switch构造查看option.theme设置并将gTheme变量指向必要的颜色数组。我们对主题使用描述性名称,而不是通用名称。
定义颜色数组
// Themes
	var thPink = ['#FFCCCC','#FFCCCC','#FFC0C0','#FFB5B5','#FFADAD','#FFA4A4','#FF9A9A','#FF8989','#FF6D6D'];
	var thBlue = ['#ACE0FF','#9CDAFF','#90D6FF','#86D2FF','#7FCFFF','#79CDFF','#72CAFF','#6CC8FF','#57C0FF'];
	var thGreen = ['#D1FFA6','#C6FF91','#C0FF86','#BCFF7D','#B6FF72','#B2FF6B','#AAFE5D','#A5FF51','#9FFF46'];
	var thAssorted = ['#FF93C2','#FF93F6','#E193FF','#B893FF','#93A0FF','#93D7FF','#93F6FF','#ABFF93','#FF9B93'];
然后我们定义许多数组,每个数组保存一系列特定颜色的色调。它们从较浅的色调开始并不断增加。稍后我们将循环遍历这些数组。添加主题就像添加您需要的特定颜色的数组一样简单,然后修改之前的开关以反映更改。
辅助函数
function getColour (param)
      {
         return Math.ceil(Math.abs(((gValues.length/2) -param)));
	  }
这是一个很小的函数,可以让我们实现类似渐变的效果并将其应用于图表。本质上,我们计算要渲染的值数量的一半与传递的参数(即数组中当前所选项目的索引)之间的绝对差。这样,我们就能够创建平滑的渐变。由于我们只在每个颜色数组中定义了九种颜色,因此我们的图表仅限于十八个值。扩展这个数字应该是相当微不足道的。
设置fillStyle
function drawGraph ()
	 {
	    for(index=0; index<gValues.length; index++)
	      {
		    ctx.save();
			ctx.fillStyle = gTheme[getColour(index)];
	        ctx.fillRect( x(index), y(gValues[index]), width(), height(gValues[index]));
		    ctx.restore();
	      }
	 }
这是我们实际为图表设置主题的地方。我们没有为 fillStyle 属性设置静态值,而是使用 getColour 函数来检索当前所选主题数组中元素的必要索引。
不透明度
接下来,我们将让用户能够控制所绘制条形的不透明度。设置过程分为两步。

不透明
值为 0.8
将其添加到选项
var defaults = {
            // Other defaults here
	 	 	 barOpacity : 0.8,
           };
我们在默认值中添加了一个 barOpacity 选项,使用户能够将图形的不透明度更改为 0 到 1 之间的值,其中 0 是完全透明,1 是完全不透明。
设置globalAlpha
function drawGraph ()
	 {
	    for(index=0; index<gValues.length; index++)
	      {
		    ctx.save();
			ctx.fillStyle = gTheme[getColour(index)];
            ctx.globalAlpha = option.barOpacity;
	        ctx.fillRect( x(index), y(gValues[index]), width(), height(gValues[index]));
		    ctx.restore();
	      }
	 }
globalAlpha 属性控制渲染元素的不透明度或透明度。我们将此属性的值设置为传递的值或默认值以增加一点透明度。作为合理的默认值,我们使用值 0.8 使其稍微透明。
网格
网格对于处理图表中呈现的数据非常有用。虽然我最初想要一个合适的网格,但后来我选择了一系列与 Y 轴标签对齐的水平线,并完全抛弃了垂直线,因为它们只是妨碍了数据。解决了这个问题,让我们来实现一种渲染它的方法。

禁用网格
启用网格
使用路径和lineTo方法创建线条似乎是绘制图形最明显的解决方案,但我碰巧遇到了一个渲染错误,这使得这种方法不适合。因此,我也坚持使用 fillRect 方法来创建这些线。这是完整的函数。
function drawGrid ()
      {
		  for(index=0; index<option.numYlabels; index++)
	      {
		   ctx.fillStyle = "#AAA";
		   ctx.fillRect( option.xOffset, y(yLabels[index])+3, gWidth, 1);
		  }
      }
这与绘制 Y 轴标签非常相似,只不过我们不是渲染标签,而是绘制一条横跨图形宽度、宽度为 1 px 的水平线。 y 函数帮助我们定位。
将其添加到选项
var defaults = {
             // Other defaults here
	 	 	 disableGrid : false,
           };
我们在默认值中添加了一个 disableGrid 选项,使用户能够控制是否渲染网格。默认情况下,它是渲染的。
    // Function calls
    	if(!option.disableGrid) { drawGrid(); }
我们只是检查用户是否希望渲染网格并进行相应操作。
大纲
现在条形图都已着色,在较浅的背景下缺乏强调。为了纠正这个问题,我们需要 1px 的描边。有两种方法可以做到这一点。第一种也是最简单的方法是在 drawGraph 方法中添加一个 strokeRect 方法;或者,我们可以使用 lineTo 方法来快速绘制矩形。我选择了前一条路线,因为像之前一样,lineTo 方法向我抛出了一些奇怪的渲染错误。

没有抚摸
抚摸
将其添加到选项
首先,我们将其添加到defaults对象中,以便用户控制是否应用它。
var defaults = {
             // Other defaults here
	 	 	 showOutline : true,
           };
function drawGraph ()
	 {
	       // Previous code
			if (option.showOutline)
			{
			ctx.fillStyle = "#000";
			ctx.strokeRect( x(index), y(gValues[index]), width(), height(gValues[index]));
			}
			// Rest of the code
	      }
	 }
我们检查用户是否想要渲染轮廓,如果是,我们继续。这与渲染实际条形几乎相同,只是我们使用 tripleRect 方法而不是使用 fillRect 方法。
阴影
在原始实现中,画布元素本身和条形的实际渲染空间之间没有区别。我们现在就纠正这个问题。

无底纹
有底纹
function shadeGraphArea ()
      {
	    ctx.fillStyle = "#F2F2F2";
	    ctx.fillRect(option.xOffset, 0, gWidth-option.xOffset, gHeight);
      }
这是一个很小的函数,可以遮蔽所需区域。我们覆盖画布元素减去两个轴标签覆盖的区域。前两个参数指向起点的x和y坐标,后两个参数指向所需的宽度和高度。从 option.offset 开始,我们消除了 Y 轴标签覆盖的区域,并通过将高度限制为 gHeight,我们消除了 X 轴标签。
添加功能
现在我们的图表看起来足够漂亮了,我们可以集中精力向我们的插件添加一些新功能。我们将分别讨论每一个。
考虑这张著名的 8K 峰值图。
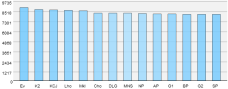
当最高值足够高,并且大多数值落在最大值的 10% 以内时,图表就不再有用。我们有两种方法来纠正这个问题。
显示值
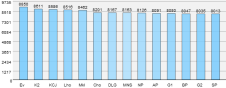
我们将首先从更简单的解决方案开始。通过将各个图表的值呈现在顶部,实际上解决了问题,因为可以轻松地区分各个值。下面是它的实现方式。
var defaults = {
             // Other defaults here
	 	 	 showValue: true,
           };
首先,我们向 defaults 对象添加一个条目,以使用户能够随意打开和关闭它。
    // Function calls
	if(option.showValue) { drawValue(); }
我们检查用户是否希望显示该值并进行相应处理。
function drawValue ()
      {
		  for(index=0; index<gValues.length; index++)
	      {
		      ctx.save();
			  ctx.fillStyle= "#000";
			  ctx.font = "10px 'arial'";
			  var valAsString = gValues[index].toString();
		      var valX = (option.barWidth/2)-(valAsString.length*3);
		      ctx.fillText(gValues[index], x(index)+valX,  y(gValues[index])-4);
			  ctx.restore();
		  }
      }
我们迭代gValues数组并单独渲染每个值。涉及 valAsString 和 valX 的计算只不过是帮助我们正确缩进的微小计算,因此它看起来并不不合适。
规模
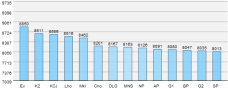
这是两个解决方案中更难的一个。在此方法中,我们不是从 0 开始 Y 轴标签,而是从更接近最小值的位置开始。我们边走边解释。请注意,在上面的示例中,后续值相对于最大值之间的差异非常微不足道,并且没有显示出其有效性。其他数据集应该更容易解析结果。
将其添加到选项
var defaults = {
             // Other defaults here
	 	 	 scale: false
           };
更新比例函数
由于scale函数是渲染过程中不可或缺的一部分,因此我们需要更新它以允许缩放功能。我们像这样更新它:
function scale (param)
      {
	   return ((option.scale) ? Math.round(((param-minVal)/(maxVal-minVal))*gHeight) : Math.round((param/maxVal)*gHeight));
      }
我知道这看起来有点复杂,但它看起来只是因为使用了三元条件运算符。本质上,我们检查 option.scale 的值,如果它为 false,则执行旧代码。如果为真,我们现在不会将值标准化为数组中最大值的函数,而是将其标准化为最大值和最小值之差的函数。这让我们想到:
更新maxValues函数
我们现在需要找出最大值和最小值,而不是之前只能找出最大值。函数更新为:
function minmaxValues (arr)
     {
		maxVal=0;

	    for(i=0; i<arr.length; i++)
	    {
		 if (maxVal<parseInt(arr[i]))
		 {
		 maxVal=parseInt(arr[i]);
	     }
	    }
		minVal=maxVal;
		for(i=0; i<arr.length; i++)
	    {
		 if (minVal>parseInt(arr[i]))
		 {
		 minVal=parseInt(arr[i]);
	     }
		}
	   maxVal*= 1.1;
       minVal = minVal - Math.round((maxVal/10));
	 }
我确信您可以在一个循环中完成相同的任务,而无需使用像我一样多的代码行,但当时我感觉特别没有创造力,所以请耐心等待。完成计算手续后,我们将 maxVal 变量增加 5%,将 minVal 变量增加 5%,减去 minVal 的 5% >maxVal 的 值。这是为了确保条形不会每次都接触顶部,并且每个 Y 轴标签之间的差异是均匀的。
更新drawYlabels函数
完成所有基础工作后,我们现在继续更新 Y 轴标签渲染例程以反映缩放。
function drawYlabels()
      {
		 ctx.save();
	     for(index=0; index<option.numYlabels; index++)
	      {
			  if (!option.scale)
			  {
		  		 yLabels.push(Math.round(maxVal/option.numYlabels*(index+1)));
			  }
			  else
			  {
				  var val= minVal+Math.ceil(((maxVal-minVal)/option.numYlabels)*(index+1));
		  		  yLabels.push(Math.ceil(val));
			  }
		   ctx.fillStyle = option.labelColour;
		   var valAsString = yLabels[index].toString();
		   var lblX = option.xOffset - (valAsString.length*7);
		   ctx.fillText(yLabels[index], lblX, y(yLabels[index])+10);
	      }
		   if (!option.scale)
		   {
	        	ctx.fillText("0", option.xOffset -7, gHeight+7);
		   }
		  else
		  {
		    var valAsString = minVal.toString();
		    var lblX = option.xOffset - (valAsString.length*7);
		    ctx.fillText(minVal, lblX, gHeight+7);
		  }
		  ctx.restore();
      }
如果你问我的话,更新内容相当丰富!功能的核心保持不变。我们只是检查用户是否启用了扩展并根据需要分支代码。如果启用,我们会更改 Y 标签的分配方式,以确保它们遵循新算法。现在,我们不再将最大值划分为 n 个均匀间隔的数字,而是计算最大值和最小值之间的差值,将其划分为均匀间隔的数字,并将其添加到最小值以构建 Y 轴标签数组。之后,我们照常进行,单独渲染每个标签。由于我们手动渲染了最底部的 0,因此我们必须检查是否启用了缩放,然后在其位置渲染最小值。不要介意每个传递参数的小数字添加;只是为了确保图表的每个元素都按预期排列。
动态调整大小
在我们之前的实现中,我们对图表的维度进行了硬编码,当值的数量发生变化时,这会带来很大的困难。我们现在要纠正这个问题。
将其添加到选项
var defaults = {
            // Other defaults here
	 	 	 cvHeight: 250, //In px
           };
我们让用户单独设置canvas元素的高度。所有其他值都是动态计算的并根据需要应用。
更新initCanvas函数
initCanvas 函数处理所有画布初始化,因此需要更新以实现新功能。
function initCanvas ()
	 {
		 $("#"+dataSource).after("<canvas id=\"bargraph-"+dataSource+"\" class=\"barGraph\"> </canvas>");

	 	// Try to access the canvas element
     	cv = $("#bargraph-"+dataSource).get(0);
	 	cv.width=gValues.length*(option.barSpacing+option.barWidth)+option.xOffset+option.barSpacing;
		cv.height=option.cvHeight;
		gWidth=cv.width;
		gHeight=option.cvHeight-20;

	 	if (!cv.getContext)
	 	{ return; }

     	// Try to get a 2D context for the canvas and throw an error if unable to
     	ctx = cv.getContext('2d');
	 	if (!ctx)
	 	{ return; }
	 }
注入canvas元素后,我们获得了对所创建元素的引用。画布元素的宽度计算为数组中元素数量的函数 - gValues ,每个条之间的空间 - option.barSpacing ,每个条本身的宽度- option.barWidth 和最后option.xOffset。图表的宽度根据每个参数动态变化。高度是用户可修改的,默认为 220 像素,栏本身的渲染区域为 220 像素。 20px 分配给 X 轴标签。
隐藏来源
创建图表后,用户可能希望隐藏源表,这是有道理的。考虑到这一点,我们让用户决定是否删除该表。
var defaults = {
            // Other defaults here
			 hideDataSource: true,
           };
if (option.hideDataSource) { $("#"+dataSource).remove();}
我们检查用户是否想要隐藏表格,如果是,我们使用 jQuery 的 remove 方法将其从 DOM 中完全删除。
优化我们的代码
现在所有的艰苦工作都已经完成,我们可以回顾一下如何优化我们的代码。由于该代码完全是为了教学目的而编写的,因此大部分工作都被封装为单独的函数,而且它们比需要的要冗长得多。
如果您确实想要尽可能精简的代码,我们的整个插件(不包括初始化和计算)可以在两个循环内重写。一个循环遍历 gValues 数组来绘制条形本身和 X 轴标签;第二个循环从 0 迭代到 numYlabels 以渲染网格和 Y 轴标签。代码看起来会更加混乱,但是,它应该会导致代码库明显更小。
摘要
就是这样,伙计们!我们完全从头开始创建了一个高级插件。我们研究了本系列中的许多主题,包括:
- 查看画布元素的渲染方案。
- canvas 元素的一些渲染方法。
- 标准化值使我们能够将其表达为另一个值的函数。
- 使用 jQuery 的一些有用的数据提取技术。
- 渲染图表的核心逻辑。
- 将我们的脚本转换为成熟的 jQuery 插件。
- 如何增强视觉效果并进一步扩展其功能。
我希望您在读这篇文章时和我在写它时一样享受乐趣。这是一个 270 多行的作品,我确信我遗漏了一些东西。欢迎点击评论并询问我。或者批评我。或者夸奖我。你知道,这是你的决定!快乐编码!
The above is the detailed content of Continuing the Canvas Fun: Building a Bar Chart Plugin, Part 2. For more information, please follow other related articles on the PHP Chinese website!

 JavaScript in Action: Real-World Examples and ProjectsApr 19, 2025 am 12:13 AM
JavaScript's application in the real world includes front-end and back-end development. 1) Display front-end applications by building a TODO list application, involving DOM operations and event processing. 2) Build RESTfulAPI through Node.js and Express to demonstrate back-end applications.
 JavaScript and the Web: Core Functionality and Use CasesApr 18, 2025 am 12:19 AM
The main uses of JavaScript in web development include client interaction, form verification and asynchronous communication. 1) Dynamic content update and user interaction through DOM operations; 2) Client verification is carried out before the user submits data to improve the user experience; 3) Refreshless communication with the server is achieved through AJAX technology.
 Understanding the JavaScript Engine: Implementation DetailsApr 17, 2025 am 12:05 AM
Understanding how JavaScript engine works internally is important to developers because it helps write more efficient code and understand performance bottlenecks and optimization strategies. 1) The engine's workflow includes three stages: parsing, compiling and execution; 2) During the execution process, the engine will perform dynamic optimization, such as inline cache and hidden classes; 3) Best practices include avoiding global variables, optimizing loops, using const and lets, and avoiding excessive use of closures.
 Python vs. JavaScript: The Learning Curve and Ease of UseApr 16, 2025 am 12:12 AM
Python is more suitable for beginners, with a smooth learning curve and concise syntax; JavaScript is suitable for front-end development, with a steep learning curve and flexible syntax. 1. Python syntax is intuitive and suitable for data science and back-end development. 2. JavaScript is flexible and widely used in front-end and server-side programming.
 Python vs. JavaScript: Community, Libraries, and ResourcesApr 15, 2025 am 12:16 AM
Python and JavaScript have their own advantages and disadvantages in terms of community, libraries and resources. 1) The Python community is friendly and suitable for beginners, but the front-end development resources are not as rich as JavaScript. 2) Python is powerful in data science and machine learning libraries, while JavaScript is better in front-end development libraries and frameworks. 3) Both have rich learning resources, but Python is suitable for starting with official documents, while JavaScript is better with MDNWebDocs. The choice should be based on project needs and personal interests.
 From C/C to JavaScript: How It All WorksApr 14, 2025 am 12:05 AM
The shift from C/C to JavaScript requires adapting to dynamic typing, garbage collection and asynchronous programming. 1) C/C is a statically typed language that requires manual memory management, while JavaScript is dynamically typed and garbage collection is automatically processed. 2) C/C needs to be compiled into machine code, while JavaScript is an interpreted language. 3) JavaScript introduces concepts such as closures, prototype chains and Promise, which enhances flexibility and asynchronous programming capabilities.
 JavaScript Engines: Comparing ImplementationsApr 13, 2025 am 12:05 AM
Different JavaScript engines have different effects when parsing and executing JavaScript code, because the implementation principles and optimization strategies of each engine differ. 1. Lexical analysis: convert source code into lexical unit. 2. Grammar analysis: Generate an abstract syntax tree. 3. Optimization and compilation: Generate machine code through the JIT compiler. 4. Execute: Run the machine code. V8 engine optimizes through instant compilation and hidden class, SpiderMonkey uses a type inference system, resulting in different performance performance on the same code.
 Beyond the Browser: JavaScript in the Real WorldApr 12, 2025 am 12:06 AM
JavaScript's applications in the real world include server-side programming, mobile application development and Internet of Things control: 1. Server-side programming is realized through Node.js, suitable for high concurrent request processing. 2. Mobile application development is carried out through ReactNative and supports cross-platform deployment. 3. Used for IoT device control through Johnny-Five library, suitable for hardware interaction.


Hot AI Tools

Undresser.AI Undress
AI-powered app for creating realistic nude photos

AI Clothes Remover
Online AI tool for removing clothes from photos.

Undress AI Tool
Undress images for free

Clothoff.io
AI clothes remover

AI Hentai Generator
Generate AI Hentai for free.

Hot Article
Hot Tools

MinGW - Minimalist GNU for Windows
This project is in the process of being migrated to osdn.net/projects/mingw, you can continue to follow us there. MinGW: A native Windows port of the GNU Compiler Collection (GCC), freely distributable import libraries and header files for building native Windows applications; includes extensions to the MSVC runtime to support C99 functionality. All MinGW software can run on 64-bit Windows platforms.

SAP NetWeaver Server Adapter for Eclipse
Integrate Eclipse with SAP NetWeaver application server.

Dreamweaver Mac version
Visual web development tools

EditPlus Chinese cracked version
Small size, syntax highlighting, does not support code prompt function

Safe Exam Browser
Safe Exam Browser is a secure browser environment for taking online exams securely. This software turns any computer into a secure workstation. It controls access to any utility and prevents students from using unauthorized resources.

