
Animation effects and trigger event optimization of Vue statistical charts
In web development, data visualization is a very important part. Vue is a popular JavaScript framework that provides a concise and efficient way to build interactive data visualization charts. This article will introduce how to implement the animation effect of statistical charts and optimize the triggering events in Vue.
- Animation effect
Animation effect is very important for statistical charts, it can make the chart more vivid and attractive. Vue provides a simple way to achieve animation effects, using Vue's transition and dynamic transition (transition-group) components.
For example, we can use the transition component to add animation effects to the histogram. First, use the transition component in the template to wrap the elements that need to be animated, and then trigger the animation effect by adding the CSS transition class name. The following is a simple example:
<template>
  <div>
    <transition name="fade">
      <div v-for="(item, index) in chartData" :key="index" class="chart-bar">
        {{item}}
      </div>
    </transition>
  </div>
</template>

<script>
export default {
  data() {
    return {
      chartData: [10, 20, 30, 40, 50]
    }
  }
}
</script>

<style>
.fade-enter-active, .fade-leave-active {
  transition: opacity 0.5s;
}
.fade-enter, .fade-leave-to {
  opacity: 0;
}
.chart-bar {
  height: 20px;
  margin-bottom: 10px;
  background-color: blue;
  color: white;
}
</style>
In the above code, we use the transition component on the div element and set the name attribute to "fade". When the data changes, Vue will automatically add a CSS transition class name to the element to trigger the animation effect.
- Trigger event optimization
In practical applications, charts usually have some interactive functions, such as triggering an event when a bar chart is clicked. However, binding events in Vue is not always efficient, especially when there are a large number of chart elements to process. In order to optimize the performance of triggered events, we can use Vue's event proxy mechanism.
Event delegation is a technology that delegates event processing to parent elements. In Vue, we can use event modifiers to implement event delegation. Here is an example:
<template>
  <div @click="handleClick" class="chart-container">
    <div v-for="(item, index) in chartData" :key="index" class="chart-bar">
      {{item}}
    </div>
  </div>
</template>

<script>
export default {
  data() {
    return {
      chartData: [10, 20, 30, 40, 50]
    }
  },
  methods: {
    handleClick(event) {
      const target = event.target
      if (target.classList.contains('chart-bar')) {
        // 处理点击事件
      }
    }
  }
}
</script>

<style scoped>
.chart-container {
  display: flex;
  flex-direction: column;
}
.chart-bar {
  height: 20px;
  margin-bottom: 10px;
  background-color: blue;
  color: white;
}
</style>
In the above code, we added the event handler function handleClick on the click event of the parent element. When div.chart-bar is clicked, the event will bubble up to the parent element and obtain the target element through the event.target property. We then determine whether to trigger the event by determining whether the target element has a specific class name.
By using event proxies, we can reduce the number of event bindings, thereby improving performance.
Summary
This article introduces how to implement the animation effect of statistical charts and the optimization of trigger events in Vue. By using Vue's transition component and event proxy mechanism, we can implement interactive data visualization charts simply and efficiently. I hope this article will help you build statistical charts in Vue!
The above is the detailed content of Animation effects and trigger event optimization of Vue statistical charts. For more information, please follow other related articles on the PHP Chinese website!
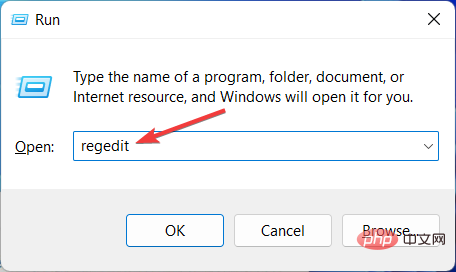 如何加速Windows 11中的动画效果:2种方法解析Apr 24, 2023 pm 04:55 PM
当微软推出Windows11时,它带来了许多变化。其中一项更改是增加了用户界面动画的数量。一些用户想要改变事物的出现方式,他们必须想办法去做。拥有动画让用户感觉更好、更友好。动画使用视觉效果使计算机看起来更具吸引力和响应能力。其中一些包括几秒钟或几分钟后的滑动菜单。计算机上有许多动画会影响PC性能、减慢速度并影响您的工作。在这种情况下,您必须关闭动画。本文将介绍用户可以提高其在PC上的动画速度的几种方法。您可以使用注册表编辑器或您运行的自定义文件来应用更改。如何提高Windows11动画的
 如何使用Vue实现打字机动画特效Sep 19, 2023 am 09:33 AM
如何使用Vue实现打字机动画特效打字机动画是一种常见且引人注目的特效,常用于网站的标题、标语等文字展示上。在Vue中,我们可以通过使用Vue自定义指令来实现打字机动画效果。本文将详细介绍如何使用Vue来实现这一特效,并提供具体的代码示例。步骤1:创建Vue项目首先,我们需要创建一个Vue项目。可以使用VueCLI来快速创建一个新的Vue项目,或者手动在HT
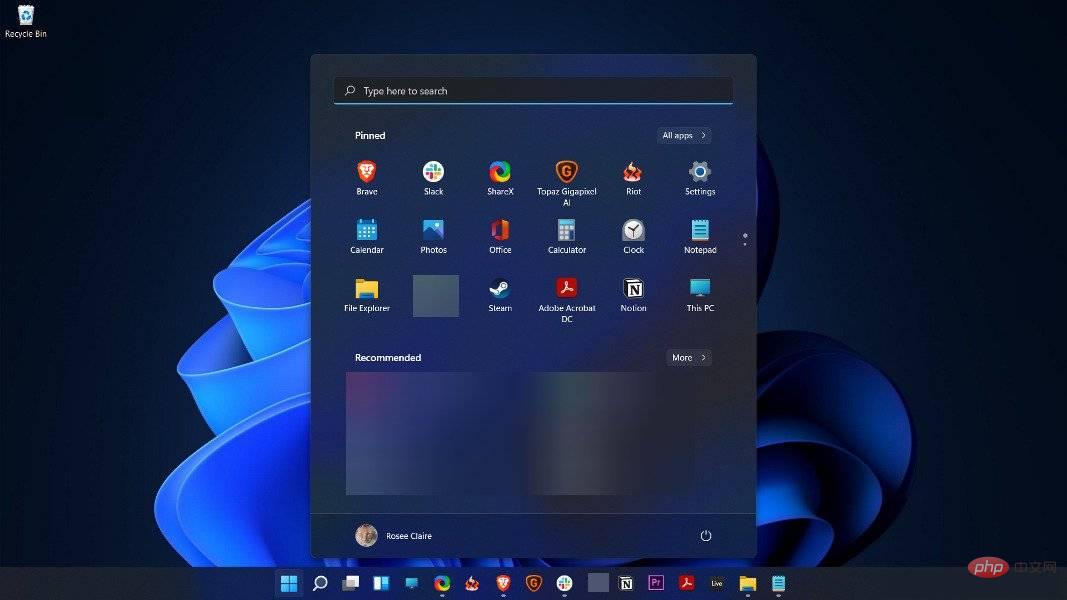 如何在 Windows 11 中禁用动画Apr 16, 2023 pm 11:34 PM
MicrosoftWindows11中包含多项新特性和功能。用户界面已更新,公司还引入了一些新效果。默认情况下,动画效果应用于控件和其他对象。我应该禁用这些动画吗?尽管Windows11具有视觉上吸引人的动画和淡入淡出效果,但它们可能会导致您的计算机对某些用户来说感觉迟钝,因为它们会为某些任务增加一点延迟。关闭动画以获得更灵敏的用户体验很简单。在我们看到对操作系统进行了哪些其他更改后,我们将引导您了解在Windows11中打开或关闭动画效果的方法。我们还有一篇关于如何在Windows
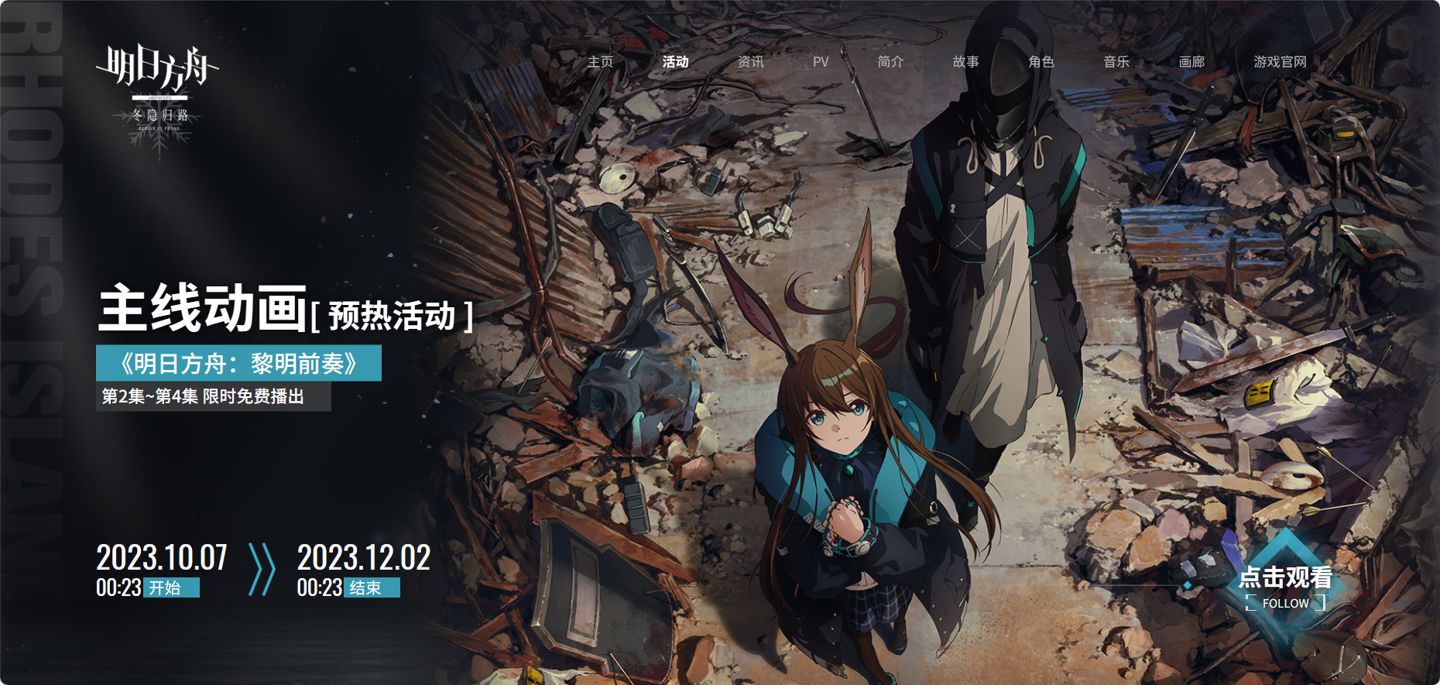 主线动画《明日方舟:冬隐归路》定档 PV 公布,10 月 7 日上线Sep 23, 2023 am 11:37 AM
本站需要重新写作的内容是:9需要重新写作的内容是:月需要重新写作的内容是:23需要重新写作的内容是:日消息,动画剧集《明日方舟》的第二季主线剧《明日方舟:冬隐归路》公布定档需要重新写作的内容是:PV,将于需要重新写作的内容是:10需要重新写作的内容是:月需要重新写作的内容是:7需要重新写作的内容是:日需要重新写作的内容是:00:23需要重新写作的内容是:正式上线,点此进入主题官网。需要重新写作的内容是:本站注意到,《明日方舟:冬隐归路》是《明日方舟:黎明前奏》的续作,剧情简介如下:为阻止感染者组
 原来利用纯CSS也能实现文字轮播与图片轮播!Jun 10, 2022 pm 01:00 PM
怎么制作文字轮播与图片轮播?大家第一想到的是不是利用js,其实利用纯CSS也能实现文字轮播与图片轮播,下面来看看实现方法,希望对大家有所帮助!
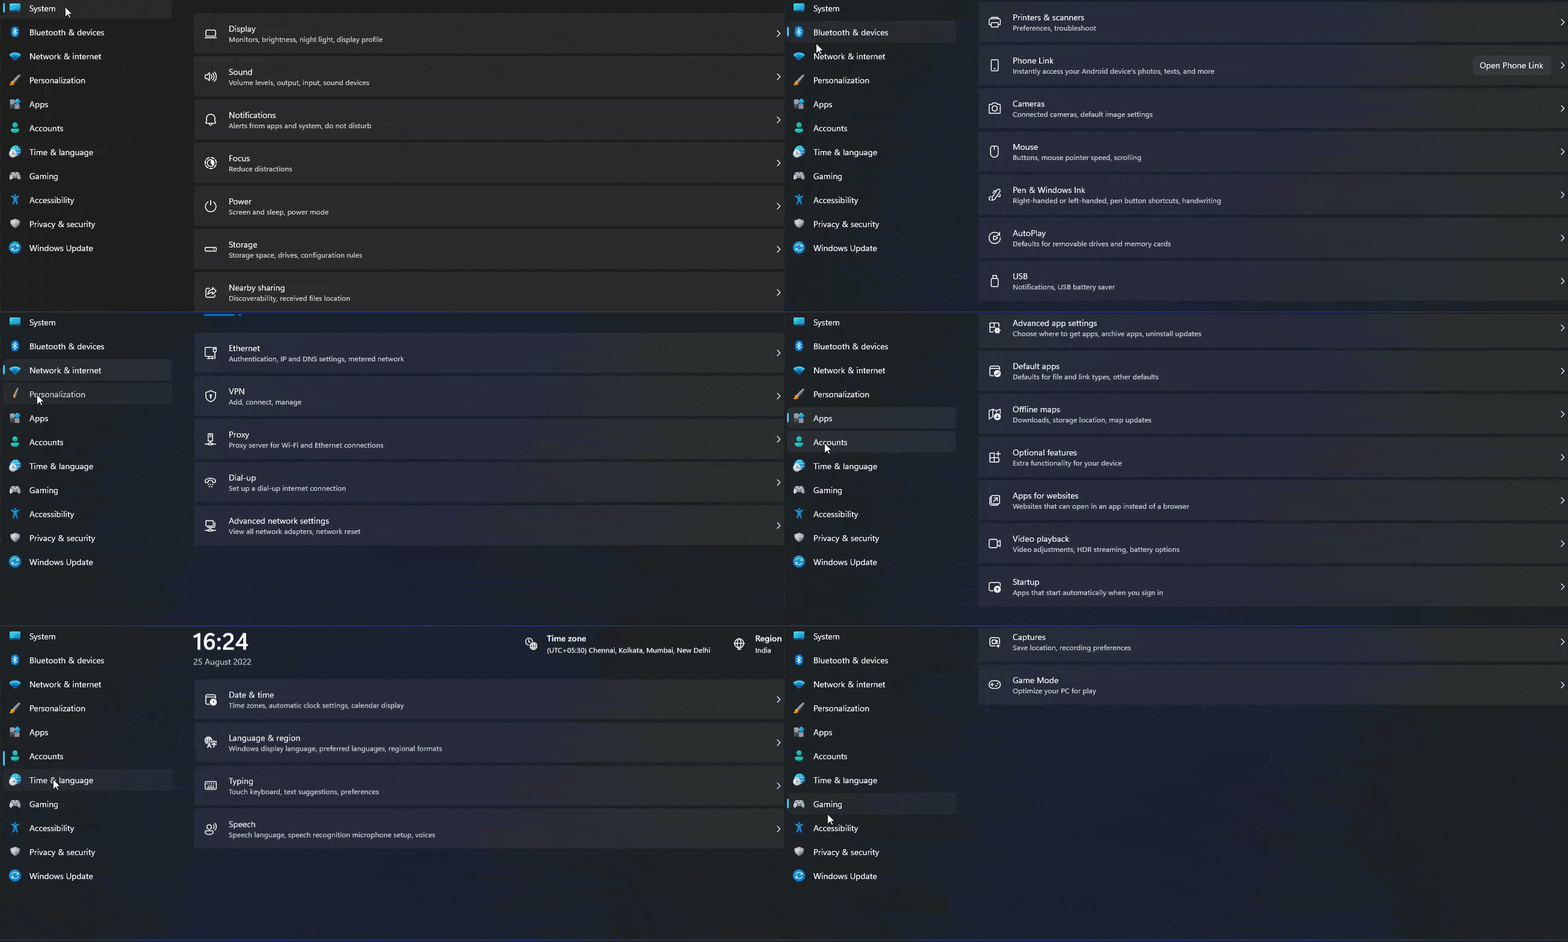 怎样在Windows 11的测试设置中启用图标动画?Apr 24, 2023 pm 11:28 PM
微软正在Windows11中试验新的任务栏动画,这是这家软件巨头正在进行的另一项新测试。这一次在设置应用程序中,当您单击相应部分时,图标会显示动画。以下是如何在Windows11中为“设置”应用启用图标动画。您可以在Windows11中看到特殊的动画和动画效果。例如,当您最小化和最大化设置应用程序或文件资源管理器时,您会注意到动画。说到图标,当您最小化窗口时,您会看到一个图标会向下弹起,而在您最大化或恢复时,它会弹起。Windows11设置可能会新收到左侧显示的导航图标动画,这是您
 Vue中如何实现图片的闪烁和旋转动画?Aug 17, 2023 pm 12:37 PM
Vue中如何实现图片的闪烁和旋转动画Vue.js是目前非常流行的前端框架之一,它提供了强大的工具来管理和展示页面中的数据。在Vue中,我们可以通过添加CSS样式和动画来使元素产生各种各样的效果。本文将介绍如何使用Vue和CSS来实现图片的闪烁和旋转动画。首先,我们需要准备一张图片,可以是本地的图片文件或者网络上的图片地址。我们将使用<img>标
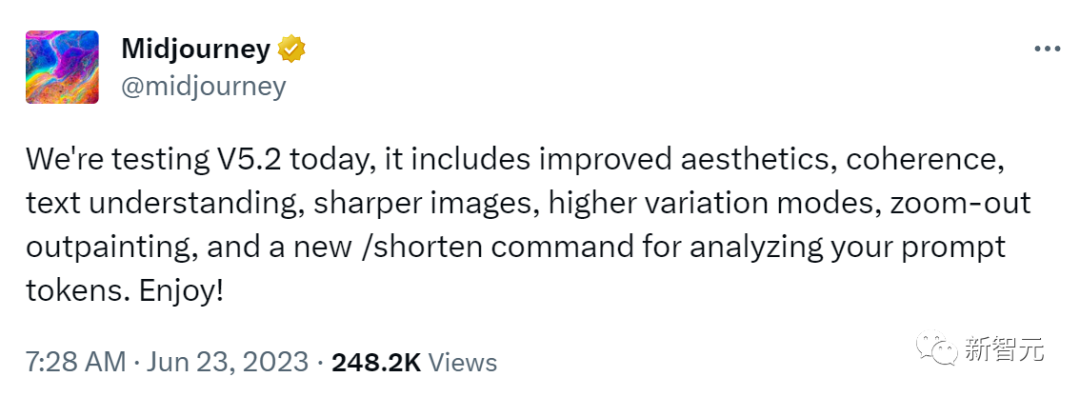 Midjourney 5.2震撼发布!原画生成3D场景,无限缩放无垠宇宙Jun 25, 2023 pm 06:55 PM
Midjourney和StableDiffusion,已经卷到没边了!几乎在StableDiffusionXL0.9发布的同一时间,Midjourney宣布推出了5.2版本。此次5.2版本最亮眼的更新在于zoomout功能,它可以无限扩展原始图像,同时保持跟原始图像的细节相同。用zoomout做出的无垠宇宙动画,直接让人震惊到失语,可以说,Midjourney5.2看得比詹姆斯韦伯太空望远镜还要远!这个极其强大的功能,可以创造出非常神奇的图片,甚至还能被用来拍摄毫无破绽的高清变焦视频!这个「核弹


Hot AI Tools

Undresser.AI Undress
AI-powered app for creating realistic nude photos

AI Clothes Remover
Online AI tool for removing clothes from photos.

Undress AI Tool
Undress images for free

Clothoff.io
AI clothes remover

AI Hentai Generator
Generate AI Hentai for free.

Hot Article

Hot Tools

MantisBT
Mantis is an easy-to-deploy web-based defect tracking tool designed to aid in product defect tracking. It requires PHP, MySQL and a web server. Check out our demo and hosting services.

Atom editor mac version download
The most popular open source editor

Dreamweaver Mac version
Visual web development tools

Notepad++7.3.1
Easy-to-use and free code editor

SublimeText3 English version
Recommended: Win version, supports code prompts!


