


Title: Using PHP and XML to generate charts and reports
In today's information age, data analysis and visualization have become indispensable for many enterprises and individuals. missing part. Generating charts and reports can visually display data and help us better understand and analyze the data. This article will introduce how to use PHP and XML to generate charts and reports, and provide relevant code examples.
1. Preparation
Before starting, we need to ensure that the PHP environment has been installed on the computer and that we have basic PHP programming capabilities. In addition, we also need to install a plug-in for creating and processing XML files, you can use PHP's SimpleXML plug-in. If you have not installed the plug-in, you can install it through the following command:
$ sudo apt-get install php-xml
2. Generate chart
-
pie chart
To generate a pie chart, we first The data needs to be prepared and then written to the XML file. The following is an example XML file content:<?xml version="1.0" encoding="UTF-8"?> <chart> <item name="A" count="20" color="#FF0000" /> <item name="B" count="30" color="#00FF00" /> <item name="C" count="50" color="#0000FF" /> </chart>
Then, we can read and parse the XML file through PHP and generate the corresponding pie chart. The following is a sample code:
<?php $xml = simplexml_load_file('data.xml'); $data = []; foreach ($xml->item as $item) { $data[(string)$item['name']] = (int)$item['count']; } $chart = new ZFrChartPieChart(); $chart->setData($data); $chart->setColors(['#FF0000', '#00FF00', '#0000FF']); $image = $chart->render(); header('Content-type: image/png'); imagepng($image); imagedestroy($image); -
Column chart
For the generation of column charts, we can use a similar approach. The following is the sample XML file content:<?xml version="1.0" encoding="UTF-8"?> <chart> <item name="Jan" value="100" color="#FF0000" /> <item name="Feb" value="200" color="#00FF00" /> <item name="Mar" value="300" color="#0000FF" /> <item name="Apr" value="400" color="#FFFF00" /> </chart>
The following is the sample code:
<?php
$xml = simplexml_load_file('data.xml');

$data = [];
foreach ($xml->item as $item) {
 $data[(string)$item['name']] = (int)$item['value'];
}

$chart = new ZFrChartBarChart();
$chart->setData($data);
$chart->setColors(['#FF0000', '#00FF00', '#0000FF', '#FFFF00']);
$image = $chart->render();

header('Content-type: image/png');
imagepng($image);
imagedestroy($image);
3. Generate reports
In addition to generating charts, we can also use PHP and XML to generate reports. The following is the content of an example XML file:
<?xml version="1.0" encoding="UTF-8"?>
<report>
  <item name="A" value="100" />
  <item name="B" value="200" />
  <item name="C" value="300" />
  <item name="D" value="400" />
</report>
The following is the example code:
<?php
$xml = simplexml_load_file('data.xml');

echo '<table>';
echo '<tr><th>Name</th><th>Value</th></tr>';
foreach ($xml->item as $item) {
    $name = (string)$item['name'];
    $value = (int)$item['value'];
    echo "<tr><td>$name</td><td>$value</td></tr>";
}
echo '</table>';
Through the above code example, we can see that PHP and XML are used to generate charts and reports and Not difficult. We only need to prepare the data and use the SimpleXML plug-in to process the XML file, and then select the corresponding chart or table to display the data according to the different types of data. I hope the content of this article will be helpful to you, and that you can further explore and apply PHP and XML technologies to better meet your data visualization needs.
The above is the detailed content of Use PHP and XML to generate charts and reports. For more information, please follow other related articles on the PHP Chinese website!

 Working with Flash Session Data in LaravelMar 12, 2025 pm 05:08 PM
Laravel simplifies handling temporary session data using its intuitive flash methods. This is perfect for displaying brief messages, alerts, or notifications within your application. Data persists only for the subsequent request by default: $request-
 cURL in PHP: How to Use the PHP cURL Extension in REST APIsMar 14, 2025 am 11:42 AM
The PHP Client URL (cURL) extension is a powerful tool for developers, enabling seamless interaction with remote servers and REST APIs. By leveraging libcurl, a well-respected multi-protocol file transfer library, PHP cURL facilitates efficient execution of various network protocols, including HTTP, HTTPS, and FTP. This extension offers granular control over HTTP requests, supports multiple concurrent operations, and provides built-in security features.
 Simplified HTTP Response Mocking in Laravel TestsMar 12, 2025 pm 05:09 PM
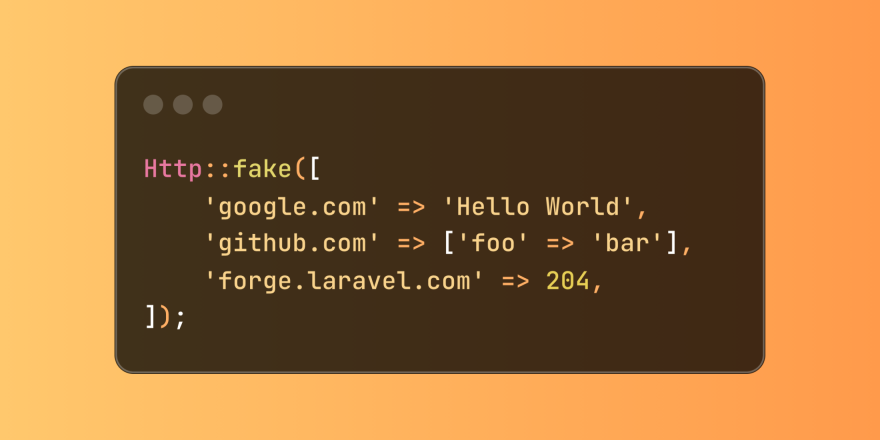
Laravel provides concise HTTP response simulation syntax, simplifying HTTP interaction testing. This approach significantly reduces code redundancy while making your test simulation more intuitive. The basic implementation provides a variety of response type shortcuts: use Illuminate\Support\Facades\Http; Http::fake([ 'google.com' => 'Hello World', 'github.com' => ['foo' => 'bar'], 'forge.laravel.com' =>
 12 Best PHP Chat Scripts on CodeCanyonMar 13, 2025 pm 12:08 PM
Do you want to provide real-time, instant solutions to your customers' most pressing problems? Live chat lets you have real-time conversations with customers and resolve their problems instantly. It allows you to provide faster service to your custom
 PHP Logging: Best Practices for PHP Log AnalysisMar 10, 2025 pm 02:32 PM
PHP logging is essential for monitoring and debugging web applications, as well as capturing critical events, errors, and runtime behavior. It provides valuable insights into system performance, helps identify issues, and supports faster troubleshoot
 Explain the concept of late static binding in PHP.Mar 21, 2025 pm 01:33 PM
Article discusses late static binding (LSB) in PHP, introduced in PHP 5.3, allowing runtime resolution of static method calls for more flexible inheritance.Main issue: LSB vs. traditional polymorphism; LSB's practical applications and potential perfo
 HTTP Method Verification in LaravelMar 05, 2025 pm 04:14 PM
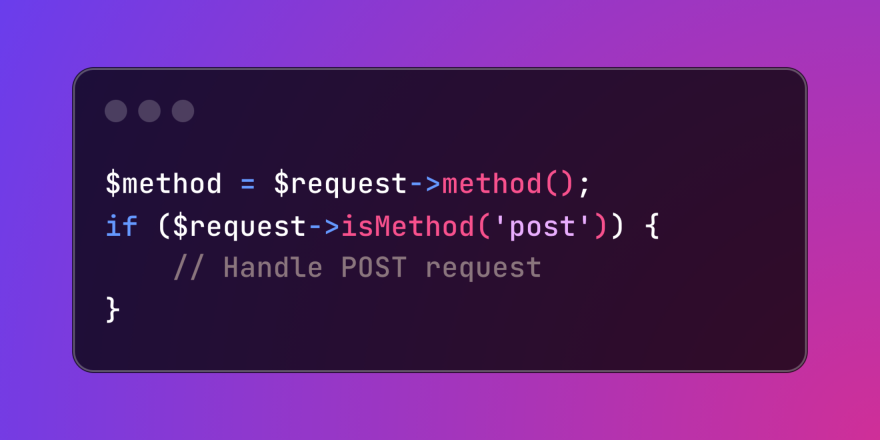
Laravel simplifies HTTP verb handling in incoming requests, streamlining diverse operation management within your applications. The method() and isMethod() methods efficiently identify and validate request types. This feature is crucial for building
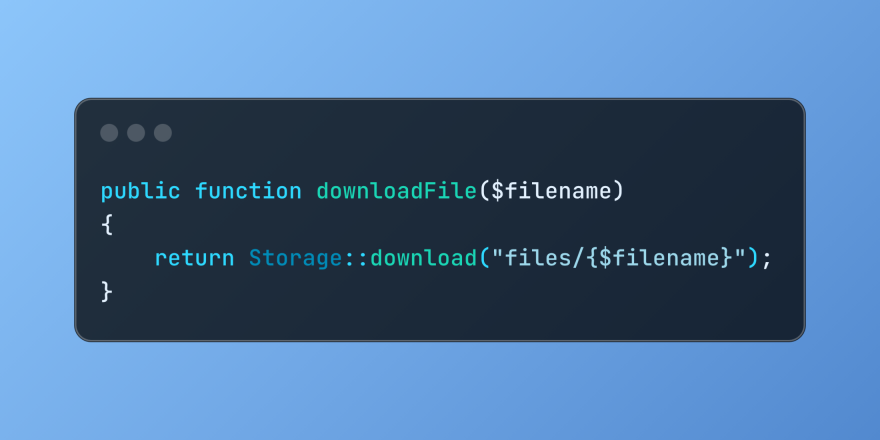 Discover File Downloads in Laravel with Storage::downloadMar 06, 2025 am 02:22 AM
The Storage::download method of the Laravel framework provides a concise API for safely handling file downloads while managing abstractions of file storage. Here is an example of using Storage::download() in the example controller:


Hot AI Tools

Undresser.AI Undress
AI-powered app for creating realistic nude photos

AI Clothes Remover
Online AI tool for removing clothes from photos.

Undress AI Tool
Undress images for free

Clothoff.io
AI clothes remover

AI Hentai Generator
Generate AI Hentai for free.

Hot Article
Hot Tools

Notepad++7.3.1
Easy-to-use and free code editor

Atom editor mac version download
The most popular open source editor

Dreamweaver Mac version
Visual web development tools

Dreamweaver CS6
Visual web development tools

DVWA
Damn Vulnerable Web App (DVWA) is a PHP/MySQL web application that is very vulnerable. Its main goals are to be an aid for security professionals to test their skills and tools in a legal environment, to help web developers better understand the process of securing web applications, and to help teachers/students teach/learn in a classroom environment Web application security. The goal of DVWA is to practice some of the most common web vulnerabilities through a simple and straightforward interface, with varying degrees of difficulty. Please note that this software

