


Known as the next generation monitoring system! Let's see how awesome it is

In 2013, Matt Stine of Pivotal proposed the concept of Cloud Native. Cloud Native consists of microservice architecture, DevOps and agile infrastructure represented by containers to help enterprises quickly, continuously, reliably and Deliver software at scale.
In order to unify cloud computing interfaces and related standards, in July 2015, the Cloud Native Computing Foundation (CNCF), which is affiliated with the Linux Foundation, came into being. The first project to join CNCF was Google’s Kubernetes, and Prometheus was the second to join (in 2016).
Currently, Prometheus has been widely used in the monitoring system of Kubernetes clusters. Students who are interested in the history of Prometheus can check out the speech given by SoundCloud engineer Tobias Schmidt at the 2016 PromCon conference: The History of Prometheus at SoundCloud.
1. Overview of Prometheus
We can find an article on SoundCloud’s official blog about why they need to develop a new monitoring system, Prometheus: Monitoring at SoundCloud. In this article, they introduced that the monitoring system they need must meet the following four characteristics:
In short, it is the following four characteristics:
Multi-dimensional data model Convenient deployment and maintenance Flexible data collection Powerful query language
In fact, the two features of multi-dimensional data model and powerful query language are exactly what the time series database requires, so Prometheus is not only a monitoring system, but also a time series database. So why doesn't Prometheus directly use the existing time series database as back-end storage? This is because SoundCloud not only wants their monitoring system to have the characteristics of a time series database, but also needs to be very easy to deploy and maintain.
Looking at the more popular time series databases (see the appendix below), they either have too many components or have heavy external dependencies. For example: Druid has a bunch of components such as Historical, MiddleManager, Broker, Coordinator, Overlord, and Router. , and also relies on ZooKeeper, Deep storage (HDFS or S3, etc.), Metadata store (PostgreSQL or MySQL), which is very expensive to deploy and maintain. Prometheus uses a decentralized architecture that can be deployed independently and does not rely on external distributed storage. You can build a monitoring system in a few minutes.
In addition, Prometheus data collection method is also very flexible. To collect the monitoring data of the target, you first need to install the data collection component at the target. This is called Exporter. It will collect monitoring data at the target and expose an HTTP interface for Prometheus to query. Prometheus collects it through Pull. Data, this is different from the traditional Push mode.
However, Prometheus also provides a way to support Push mode. You can push your data to Push Gateway, and Prometheus obtains data from Push Gateway through Pull. The current Exporter can already collect most third-party data, such as Docker, HAProxy, StatsD, JMX, etc. The official website has a list of Exporters.
In addition to these four major features, with the continuous development of Prometheus, it begins to support more and more advanced features, such as: service discovery, richer chart display, use of external storage, powerful alarm rules and diverse notification method. The following figure is the overall architecture diagram of Prometheus:
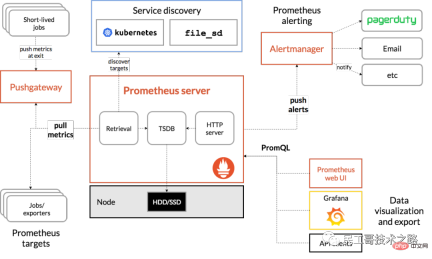
#As can be seen from the above figure, the Prometheus ecosystem includes several key components: Prometheus server, Pushgateway, Alertmanager, Web UI, etc., but most components are not required. The core component is of course the Prometheus server, which is responsible for collecting and storing indicator data, supporting expression queries, and generating alarms. Next we will install Prometheus server.
2. Install Prometheus server
Prometheus can support multiple installation methods, including Docker, Ansible, Chef, Puppet, Saltstack, etc. The two simplest methods are introduced below. One is to directly use the compiled executable file, which can be used out of the box, and the other is to use a Docker image.
2.1 Out of the box
First get the latest version and download address of Prometheus from the download page of the official website. The latest version is 2.4.3 (October 2018), execute the following command Download and unzip:
$ wget https://github.com/prometheus/prometheus/releases/download/v2.4.3/prometheus-2.4.3.linux-amd64.tar.gz
$ tar xvfz prometheus-2.4.3.linux-amd64.tar.gz
Then switch to the unzip directory and check the Prometheus version:
$ cd prometheus-2.4.3.linux-amd64
$ ./prometheus --version
prometheus, version 2.4.3 (branch: HEAD, revision: 167a4b4e73a8eca8df648d2d2043e21bdb9a7449)
  build user:       root@1e42b46043e9
  build date:       20181004-08:42:02
  go version:       go1.11.1
Run Prometheus server:
$ ./prometheus --config.file=prometheus.yml
2.2 使用 Docker 镜像
使用 Docker 安装 Prometheus 更简单,运行下面的命令即可:
$ sudo docker run -d -p 9090:9090 prom/prometheus
一般情况下,我们还会指定配置文件的位置:
$ sudo docker run -d -p 9090:9090 \
    -v ~/docker/prometheus/:/etc/prometheus/ \
    prom/prometheus
我们把配置文件放在本地 ~/docker/prometheus/prometheus.yml,这样可以方便编辑和查看,通过 -v 参数将本地的配置文件挂载到 /etc/prometheus/ 位置,这是 prometheus 在容器中默认加载的配置文件位置。如果我们不确定默认的配置文件在哪,可以先执行上面的不带 -v 参数的命令,然后通过 docker inspect 命名看看容器在运行时默认的参数有哪些(下面的 Args 参数):
$ sudo docker inspect 0c
[...]
        "Id": "0c4c2d0eed938395bcecf1e8bb4b6b87091fc4e6385ce5b404b6bb7419010f46",
        "Created": "2018-10-15T22:27:34.56050369Z",
        "Path": "/bin/prometheus",
        "Args": [
            "--config.file=/etc/prometheus/prometheus.yml",
            "--storage.tsdb.path=/prometheus",
            "--web.console.libraries=/usr/share/prometheus/console_libraries",
            "--web.console.templates=/usr/share/prometheus/consoles"
        ],

[...]
2.3 配置 Prometheus
正如上面两节看到的,Prometheus 有一个配置文件,通过参数 --config.file 来指定,配置文件格式为 YAML。我们可以打开默认的配置文件 prometheus.yml 看下里面的内容:
/etc/prometheus $ cat prometheus.yml
# my global config
global:
scrape_interval: 15s # Set the scrape interval to every 15 seconds. Default is every 1 minute.
evaluation_interval: 15s # Evaluate rules every 15 seconds. The default is every 1 minute.
# scrape_timeout is set to the global default (10s).
# Alertmanager configuration
alerting:
alertmanagers:
- static_configs:
- targets:
# - alertmanager:9093
# Load rules once and periodically evaluate them according to the global 'evaluation_interval'.
rule_files:
# - "first_rules.yml"
# - "second_rules.yml"
# A scrape configuration containing exactly one endpoint to scrape:
# Here it's Prometheus itself.
scrape_configs:
# The job name is added as a label `job=<job_name>` to any timeseries scraped from this config.
- job_name: 'prometheus'
# metrics_path defaults to '/metrics'
# scheme defaults to 'http'.
static_configs:
- targets: ['localhost:9090']Prometheus 默认的配置文件分为四大块:
global block: Global configuration of Prometheus, for example, scrape_interval indicates how often Prometheus crawls data, evaluation_interval indicates how often to detect alarm rules; alerting block: Regarding the configuration of Alertmanager, we will look at this later; rule_files block: Alert rules, we will look at this later; scrape_config block: Here the target to be captured by Prometheus is defined. We can see that a job named prometheus has been configured by default. This is because Prometheus will also expose its own indicator data through the HTTP interface when it is started, which is equivalent to Prometheus itself. Monitor yourself, although this is of little use when actually using Prometheus, we can learn how to use Prometheus through this example; you can visit http://localhost:9090/metrics to see what indicators Prometheus exposes;
3. Learning PromQL
After installing Prometheus through the above steps, we can now start to experience Prometheus. Prometheus provides a visual Web UI for our convenience. Just visit http://localhost:9090/. It will jump to the Graph page by default:
You may be overwhelmed when you visit this page for the first time. , we can first look at the content under other menus, for example: Alerts displays all the defined alarm rules, Status can view various Prometheus status information, including Runtime & Build Information, Command-Line Flags, Configuration, Rules, Targets, Service Discovery and so on.
In fact, the Graph page is the most powerful function of Prometheus. Here we can use a special expression provided by Prometheus to query monitoring data. This expression is called PromQL (Prometheus Query Language). Not only can you query data on the Graph page through PromQL, but you can also query it through the HTTP API provided by Prometheus. The queried monitoring data can be displayed in two forms: list and graph (corresponding to the two labels Console and Graph in the above figure).
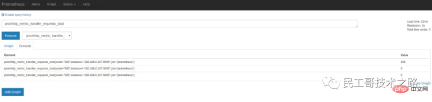
As we said above, Prometheus itself also exposes a lot of monitoring indicators, which can also be queried on the Graph page. Expand the drop-down box next to the Execute button and you can see many indicator names. We can choose one at will, for example: promhttp_metric_handler_requests_total, this indicator represents the number of visits to the /metrics page. Prometheus uses this page to capture its own monitoring data. The query results in the Console tag are as follows:
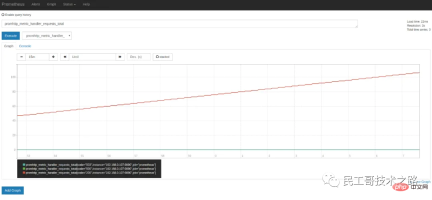
When introducing the Prometheus configuration file above, you can see that the scrape_interval parameter is 15s, which means that Prometheus accesses /metrics every 15s. page, so we refresh the page after 15 seconds, and you can see that the indicator value will increase automatically. This can be seen more clearly in the Graph tag:
3.1 数据模型
要学习 PromQL,首先我们需要了解下 Prometheus 的数据模型,一条 Prometheus 数据由一个指标名称(metric)和 N 个标签(label,N >= 0)组成的,比如下面这个例子:
promhttp\_metric\_handler\_requests\_total{code="200",instance="192.168.0.107:9090",job="prometheus"} 106这条数据的指标名称为 promhttp_metric_handler_requests_total,并且包含三个标签 code、instance 和 job,这条记录的值为 106。上面说过,Prometheus 是一个时序数据库,相同指标相同标签的数据构成一条时间序列。如果以传统数据库的概念来理解时序数据库,可以把指标名当作表名,标签是字段,timestamp 是主键,还有一个 float64 类型的字段表示值(Prometheus 里面所有值都是按 float64 存储)。另外,搜索公众号Linux就该这样学后台回复“Linux”,获取一份惊喜礼包。
这种数据模型和 OpenTSDB 的数据模型是比较类似的,详细的信息可以参考官网文档 Data model。
虽然 Prometheus 里存储的数据都是 float64 的一个数值,但如果我们按类型来分,可以把 Prometheus 的数据分成四大类:
Counter Gauge - ##Histogram
- Summary
3.2 PromQL 入门
我们从一些例子开始学习 PromQL,最简单的 PromQL 就是直接输入指标名称,比如:
# 表示 Prometheus 能否抓取 target 的指标,用于 target 的健康检查
up
这条语句会查出 Prometheus 抓取的所有 target 当前运行情况,譬如下面这样:
up{instance="192.168.0.107:9090",job="prometheus"}    1
up{instance="192.168.0.108:9090",job="prometheus"}    1
up{instance="192.168.0.107:9100",job="server"}    1
up{instance="192.168.0.108:9104",job="mysql"}    0
也可以指定某个 label 来查询:
up{job="prometheus"}这种写法被称为 Instant vector selectors,这里不仅可以使用 = 号,还可以使用 !=、=~、!~,比如下面这样:
up{job!="prometheus"}
up{job=~"server|mysql"}
up{job=~"192\.168\.0\.107.+"}
#=~ 是根据正则表达式来匹配,必须符合 RE2 的语法。
和 Instant vector selectors 相应的,还有一种选择器,叫做 Range vector selectors,它可以查出一段时间内的所有数据:
http_requests_total[5m]
这条语句查出 5 分钟内所有抓取的 HTTP 请求数,注意它返回的数据类型是 Range vector,没办法在 Graph 上显示成曲线图,一般情况下,会用在 Counter 类型的指标上,并和 rate() 或 irate() 函数一起使用(注意 rate 和 irate 的区别)。
# 计算的是每秒的平均值,适用于变化很慢的 counter
# per-second average rate of increase, for slow-moving counters
rate(http_requests_total[5m])

# 计算的是每秒瞬时增加速率,适用于变化很快的 counter
# per-second instant rate of increase, for volatile and fast-moving counters
irate(http_requests_total[5m])
此外,PromQL 还支持 count、sum、min、max、topk 等 聚合操作,还支持 rate、abs、ceil、floor 等一堆的 内置函数,更多的例子,还是上官网学习吧。如果感兴趣,我们还可以把 PromQL 和 SQL 做一个对比,会发现 PromQL 语法更简洁,查询性能也更高。
3.3 HTTP API
我们不仅仅可以在 Prometheus 的 Graph 页面查询 PromQL,Prometheus 还提供了一种 HTTP API 的方式,可以更灵活的将 PromQL 整合到其他系统中使用,譬如下面要介绍的 Grafana,就是通过 Prometheus 的 HTTP API 来查询指标数据的。实际上,我们在 Prometheus 的 Graph 页面查询也是使用了 HTTP API。
我们看下 Prometheus 的 HTTP API 官方文档,它提供了下面这些接口:
GET /api/v1/query
GET /api/v1/query_range
GET /api/v1/series
GET /api/v1/label/<label_name>/values
GET /api/v1/targets
GET /api/v1/rules
GET /api/v1/alerts
GET /api/v1/targets/metadata
GET /api/v1/alertmanagers
GET /api/v1/status/config
GET /api/v1/status/flags
从 Prometheus v2.1 开始,又新增了几个用于管理 TSDB 的接口:
POST /api/v1/admin/tsdb/snapshot
POST /api/v1/admin/tsdb/delete_series
POST /api/v1/admin/tsdb/clean_tombstones
四、安装 Grafana
虽然 Prometheus 提供的 Web UI 也可以很好的查看不同指标的视图,但是这个功能非常简单,只适合用来调试。要实现一个强大的监控系统,还需要一个能定制展示不同指标的面板,能支持不同类型的展现方式(曲线图、饼状图、热点图、TopN 等),这就是仪表盘(Dashboard)功能。
因此 Prometheus 开发了一套仪表盘系统 PromDash,不过很快这套系统就被废弃了,官方开始推荐使用 Grafana 来对 Prometheus 的指标数据进行可视化,这不仅是因为 Grafana 的功能非常强大,而且它和 Prometheus 可以完美的无缝融合。
Grafana 是一个用于可视化大型测量数据的开源系统,它的功能非常强大,界面也非常漂亮,使用它可以创建自定义的控制面板,你可以在面板中配置要显示的数据和显示方式,它 支持很多不同的数据源,比如:Graphite、InfluxDB、OpenTSDB、Elasticsearch、Prometheus 等,而且它也 支持众多的插件。
下面我们就体验下使用 Grafana 来展示 Prometheus 的指标数据。首先我们来安装 Grafana,我们使用最简单的 Docker 安装方式:
$ docker run -d -p 3000:3000 grafana/grafana
运行上面的 docker 命令,Grafana 就安装好了!你也可以采用其他的安装方式,参考 官方的安装文档。安装完成之后,我们访问 http://localhost:3000/ 进入 Grafana 的登陆页面,输入默认的用户名和密码(admin/admin)即可。
要使用 Grafana,第一步当然是要配置数据源,告诉 Grafana 从哪里取数据,我们点击 Add data source 进入数据源的配置页面:
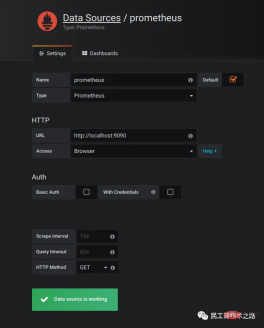
我们在这里依次填上:
Name: prometheus Type: Prometheus URL: http://localhost:9090 Access: Browser
It should be noted that Access here refers to the way Grafana accesses the data source. There are two ways: Browser and Proxy. . The Browser mode means that when the user accesses the Grafana panel, the browser directly accesses the data source through the URL; while the Proxy mode means that the browser first accesses a proxy interface of Grafana (the interface address is /api/datasources/proxy/), which is controlled by Grafana's proxy interface. The server accesses the URL of the data source. This method is very useful if the data source is deployed on an intranet and cannot be accessed directly by users through a browser.
After configuring the data source, Grafana will provide several configured panels for you to use by default. As shown in the figure below, three panels are provided by default: Prometheus Stats, Prometheus 2.0 Stats and Grafana metrics. Click Import to import and use this panel.
We import the Prometheus 2.0 Stats panel and you can see the following monitoring panel. If your company has the conditions, you can apply for a large monitor to hang on the wall, project this panel on the big screen, and observe the status of the online system in real time. It can be said to be very cool.
5. Use Exporter to collect indicators
So far, what we have seen are only some indicators that have no practical use. If we want to really use Prometheus in our production environment, It is often necessary to pay attention to various indicators, such as the server's CPU load, memory usage, IO overhead, incoming and outgoing network traffic, etc.
As mentioned above, Prometheus uses the Pull method to obtain indicator data. In order for Prometheus to obtain data from the target, the indicator collection program must first be installed on the target and expose the HTTP interface for Prometheus Query, this indicator collection program is called Exporter. Different indicators require different Exporters to collect. Currently, there are a large number of Exporters available, covering almost all kinds of systems and software we commonly use.
The official website lists a list of commonly used Exporters. Each Exporter follows a port convention to avoid port conflicts, that is, starting from 9100 and increasing in sequence. Here is the complete Exporter port list. It is also worth noting that some software and systems do not need to install Exporter because they themselves provide the function of exposing indicator data in Prometheus format, such as Kubernetes, Grafana, Etcd, Ceph, etc.
In this section let us collect some useful data.
5.1 收集服务器指标
首先我们来收集服务器的指标,这需要安装 node_exporter,这个 exporter 用于收集 *NIX 内核的系统,如果你的服务器是 Windows,可以使用 WMI exporter。
和 Prometheus server 一样,node_exporter 也是开箱即用的:
$ wget https://github.com/prometheus/node_exporter/releases/download/v0.16.0/node_exporter-0.16.0.linux-amd64.tar.gz
$ tar xvfz node_exporter-0.16.0.linux-amd64.tar.gz
$ cd node_exporter-0.16.0.linux-amd64
$ ./node_exporter
node_exporter 启动之后,我们访问下 /metrics 接口看看是否能正常获取服务器指标:
$ curl http://localhost:9100/metrics
如果一切 OK,我们可以修改 Prometheus 的配置文件,将服务器加到 scrape_configs 中:
scrape_configs:
  - job_name: 'prometheus'
    static_configs:
      - targets: ['192.168.0.107:9090']
  - job_name: 'server'
    static_configs:
      - targets: ['192.168.0.107:9100']
修改配置后,需要重启 Prometheus 服务,或者发送 HUP 信号也可以让 Prometheus 重新加载配置:
$ killall -HUP prometheus
在 Prometheus Web UI 的 Status -> Targets 中,可以看到新加的服务器:
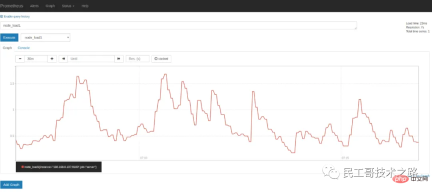
In the indicator drop-down box on the Graph page, you can see many indicators whose names start with node. For example, we enter node_load1 to observe the server load:
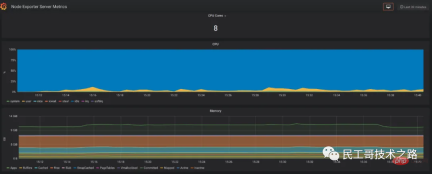
If you want to view server metrics in Grafana, you can search for node exporter on Grafana's Dashboards page. There are many panel templates that can be used directly, such as: Node Exporter Server Metrics or Node Exporter Full, etc. We open Grafana's Import dashboard page and enter the panel's URL (https://grafana.com/dashboards/405) or ID (405).
注意事项
一般情况下,node_exporter 都是直接运行在要收集指标的服务器上的,官方不推荐用 Docker 来运行 node_exporter。如果逼不得已一定要运行在 Docker 里,要特别注意,这是因为 Docker 的文件系统和网络都有自己的 namespace,收集的数据并不是宿主机真实的指标。可以使用一些变通的方法,比如运行 Docker 时加上下面这样的参数:
docker run -d \
  --net="host" \
  --pid="host" \
  -v "/:/host:ro,rslave" \
  quay.io/prometheus/node-exporter \
  --path.rootfs /host
关于 node_exporter 的更多信息,可以参考 node_exporter 的文档 和 Prometheus 的官方指南 Monitoring Linux host metrics with the Node Exporter。
5.2 收集 MySQL 指标
mysqld_exporter 是 Prometheus 官方提供的一个 exporter,我们首先 下载最新版本 并解压(开箱即用):
$ wget https://github.com/prometheus/mysqld_exporter/releases/download/v0.11.0/mysqld_exporter-0.11.0.linux-amd64.tar.gz
$ tar xvfz mysqld_exporter-0.11.0.linux-amd64.tar.gz
$ cd mysqld_exporter-0.11.0.linux-amd64/
mysqld_exporter 需要连接到 mysqld 才能收集它的指标,可以通过两种方式来设置 mysqld 数据源。第一种是通过环境变量 DATA_SOURCE_NAME,这被称为 DSN(数据源名称),它必须符合 DSN 的格式,一个典型的 DSN 格式像这样:user:password@(host:port)/。
$ export DATA_SOURCE_NAME='root:123456@(192.168.0.107:3306)/'
$ ./mysqld_exporter
另一种方式是通过配置文件,默认的配置文件是 ~/.my.cnf,或者通过 --config.my-cnf 参数指定:
$ ./mysqld_exporter --config.my-cnf=".my.cnf"
配置文件的格式如下:
$ cat .my.cnf
[client]
host=localhost
port=3306
user=root
password=123456
如果要把 MySQL 的指标导入 Grafana,可以参考 这些 Dashboard JSON。
注意事项
这里为简单起见,在 mysqld_exporter 中直接使用了 root 连接数据库,在真实环境中,可以为 mysqld_exporter 创建一个单独的用户,并赋予它受限的权限(PROCESS、REPLICATION CLIENT、SELECT),最好还限制它的最大连接数(MAX_USER_CONNECTIONS)。
CREATE USER 'exporter'@'localhost' IDENTIFIED BY 'password' WITH MAX_USER_CONNECTIONS 3;
GRANT PROCESS, REPLICATION CLIENT, SELECT ON *.* TO 'exporter'@'localhost';
5.3 收集 Nginx 指标
官方提供了两种收集 Nginx 指标的方式。
第一种是 Nginx metric library,这是一段 Lua 脚本(prometheus.lua),Nginx 需要开启 Lua 支持(libnginx-mod-http-lua 模块)。为方便起见,也可以使用 OpenResty 的 OPM(OpenResty Package Manager) 或者 luarocks(The Lua package manager) 来安装。 第二种是 Nginx VTS exporter,这种方式比第一种要强大的多,安装要更简单,支持的指标也更丰富,它依赖于 nginx-module-vts 模块,vts 模块可以提供大量的 Nginx 指标数据,可以通过 JSON、HTML 等形式查看这些指标。Nginx VTS exporter 就是通过抓取 /status/format/json 接口来将 vts 的数据格式转换为 Prometheus 的格式。
不过,在 nginx-module-vts 最新的版本中增加了一个新接口:/status/format/prometheus,这个接口可以直接返回 Prometheus 的格式,从这点这也能看出 Prometheus 的影响力,估计 Nginx VTS exporter 很快就要退役了(TODO:待验证)。
除此之外,还有很多其他的方式来收集 Nginx 的指标,比如:nginx_exporter 通过抓取 Nginx 自带的统计页面 /nginx_status 可以获取一些比较简单的指标(需要开启 ngx_http_stub_status_module 模块);nginx_request_exporter 通过 syslog 协议 收集并分析 Nginx 的 access log 来统计 HTTP 请求相关的一些指标;nginx-prometheus-shiny-exporter 和 nginx_request_exporter 类似,也是使用 syslog 协议来收集 access log,不过它是使用 Crystal 语言 写的。还有 vovolie/lua-nginx-prometheus 基于 Openresty、Prometheus、Consul、Grafana 实现了针对域名和 Endpoint 级别的流量统计。另外,搜索公众号技术社区后台回复“猴子”,获取一份惊喜礼包。
有需要或感兴趣的同学可以对照说明文档自己安装体验下,这里就不一一尝试了。
5.4 收集 JMX 指标
最后让我们来看下如何收集 Java 应用的指标,Java 应用的指标一般是通过 JMX(Java Management Extensions) 来获取的,顾名思义,JMX 是管理 Java 的一种扩展,它可以方便的管理和监控正在运行的 Java 程序。
JMX Exporter 用于收集 JMX 指标,很多使用 Java 的系统,都可以使用它来收集指标,比如:Kafaka、Cassandra 等。首先我们下载 JMX Exporter:
$ wget https://repo1.maven.org/maven2/io/prometheus/jmx/jmx_prometheus_javaagent/0.3.1/jmx_prometheus_javaagent-0.3.1.jar
JMX Exporter 是一个 Java Agent 程序,在运行 Java 程序时通过 -javaagent 参数来加载:
$ java -javaagent:jmx_prometheus_javaagent-0.3.1.jar=9404:config.yml -jar spring-boot-sample-1.0-SNAPSHOT.jar
其中,9404 是 JMX Exporter 暴露指标的端口,config.yml 是 JMX Exporter 的配置文件,它的内容可以 参考 JMX Exporter 的配置说明 。然后检查下指标数据是否正确获取:
$ curl http://localhost:9404/metrics
六、告警和通知
至此,我们能收集大量的指标数据,也能通过强大而美观的面板展示出来。不过作为一个监控系统,最重要的功能,还是应该能及时发现系统问题,并及时通知给系统负责人,这就是 Alerting(告警)。
Prometheus 的告警功能被分成两部分:一个是告警规则的配置和检测,并将告警发送给 Alertmanager,另一个是 Alertmanager,它负责管理这些告警,去除重复数据,分组,并路由到对应的接收方式,发出报警。常见的接收方式有:Email、PagerDuty、HipChat、Slack、OpsGenie、WebHook 等。
6.1 配置告警规则
我们在上面介绍 Prometheus 的配置文件时了解到,它的默认配置文件 prometheus.yml 有四大块:global、alerting、rule_files、scrape_config,其中 rule_files 块就是告警规则的配置项,alerting 块用于配置 Alertmanager,这个我们下一节再看。现在,先让我们在 rule_files 块中添加一个告警规则文件:
rule_files:
  - "alert.rules"
然后参考 官方文档,创建一个告警规则文件 alert.rules:
groups:
- name: example
rules:
# Alert for any instance that is unreachable for >5 minutes.
- alert: InstanceDown
expr: up == 0
for: 5m
labels:
severity: page
annotations:
summary: "Instance {{ $labels.instance }} down"
description: "{{ $labels.instance }} of job {{ $labels.job }} has been down for more than 5 minutes."
# Alert for any instance that has a median request latency >1s.
- alert: APIHighRequestLatency
expr: api_http_request_latencies_second{quantile="0.5"} > 1
for: 10m
annotations:
summary: "High request latency on {{ $labels.instance }}"
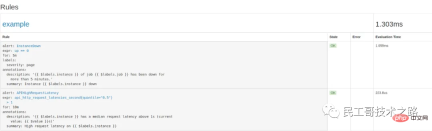
description: "{{ $labels.instance }} has a median request latency above 1s (current value: {{ $value }}s)"这个规则文件里,包含了两条告警规则:InstanceDown 和 APIHighRequestLatency。顾名思义,InstanceDown 表示当实例宕机时(up === 0)触发告警,APIHighRequestLatency 表示有一半的 API 请求延迟大于 1s 时(api_http_request_latencies_second{quantile="0.5"} > 1)触发告警。
配置好后,需要重启下 Prometheus server,然后访问 http://localhost:9090/rules 可以看到刚刚配置的规则:
访问 http://localhost:9090/alerts 可以看到根据配置的规则生成的告警:
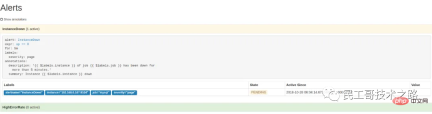
这里我们将一个实例停掉,可以看到有一条 alert 的状态是 PENDING,这表示已经触发了告警规则,但还没有达到告警条件。这是因为这里配置的 for 参数是 5m,也就是 5 分钟后才会触发告警,我们等 5 分钟,可以看到这条 alert 的状态变成了 FIRING。
6.2 使用 Alertmanager 发送告警通知
虽然 Prometheus 的 /alerts 页面可以看到所有的告警,但是还差最后一步:触发告警时自动发送通知。这是由 Alertmanager 来完成的,我们首先 下载并安装 Alertmanager,和其他 Prometheus 的组件一样,Alertmanager 也是开箱即用的:
$ wget https://github.com/prometheus/alertmanager/releases/download/v0.15.2/alertmanager-0.15.2.linux-amd64.tar.gz
$ tar xvfz alertmanager-0.15.2.linux-amd64.tar.gz
$ cd alertmanager-0.15.2.linux-amd64
$ ./alertmanager
Alertmanager 启动后默认可以通过 http://localhost:9093/ 来访问,但是现在还看不到告警,因为我们还没有把 Alertmanager 配置到 Prometheus 中,我们回到 Prometheus 的配置文件 prometheus.yml,添加下面几行:
alerting:
  alertmanagers:
  - scheme: http
    static_configs:
    - targets:
      - "192.168.0.107:9093"
这个配置告诉 Prometheus,当发生告警时,将告警信息发送到 Alertmanager,Alertmanager 的地址为 http://192.168.0.107:9093。也可以使用命名行的方式指定 Alertmanager:
$ ./prometheus -alertmanager.url=http://192.168.0.107:9093
这个时候再访问 Alertmanager,可以看到 Alertmanager 已经接收到告警了:
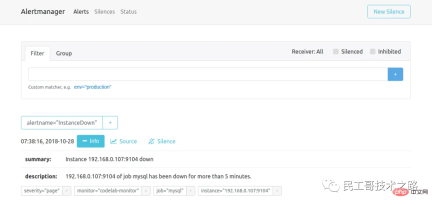
下面的问题就是如何让 Alertmanager 将告警信息发送给我们了,我们打开默认的配置文件 alertmanager.ym:
global:
  resolve_timeout: 5m

route:
  group_by: ['alertname']
  group_wait: 10s
  group_interval: 10s
  repeat_interval: 1h
  receiver: 'web.hook'
receivers:
- name: 'web.hook'
  webhook_configs:
  - url: 'http://127.0.0.1:5001/'
inhibit_rules:
  - source_match:
      severity: 'critical'
    target_match:
      severity: 'warning'
    equal: ['alertname', 'dev', 'instance']
其中 global 块表示一些全局配置;route 块表示通知路由,可以根据不同的标签将告警通知发送给不同的 receiver,这里没有配置 routes 项,表示所有的告警都发送给下面定义的 web.hook 这个 receiver;如果要配置多个路由,可以参考 这个例子:
routes:
- receiver: 'database-pager'
  group_wait: 10s
  match_re:
    service: mysql|cassandra

- receiver: 'frontend-pager'
  group_by: [product, environment]
  match:
    team: frontend
紧接着,receivers 块表示告警通知的接收方式,每个 receiver 包含一个 name 和一个 xxx_configs,不同的配置代表了不同的接收方式,Alertmanager 内置了下面这些接收方式:
email_config
hipchat_config
pagerduty_config
pushover_config
slack_config
opsgenie_config
victorops_config
wechat_configs
webhook_config
虽然接收方式很丰富,但是在国内,其中大多数接收方式都很少使用。最常用到的,莫属 email_config 和 webhook_config,另外 wechat_configs 可以支持使用微信来告警,也是相当符合国情的了。
In fact, it is difficult to provide an all-encompassing alarm notification method because there are various messaging software and each country may be different, so it is impossible to fully cover it. Therefore, Alertmanager has decided not to add new receivers. It is recommended to use webhook to integrate customized receiving methods. You can refer to these integration examples, such as connecting DingTalk to Prometheus AlertManager WebHook.
7. Learn more
At this point, we have learned most of the functions of Prometheus. Combined with Prometheus Grafana Alertmanager, we can build a very complete monitoring system. . However, when actually using it, we will find more problems.
7.1 Service Discovery
Since Prometheus actively obtains monitoring data through Pull, the list of monitoring nodes needs to be manually specified. When the number of monitored nodes increases, it needs to be changed each time a node is added. Configuration files are very troublesome, and this needs to be solved through the service discovery (SD) mechanism.
Prometheus supports multiple service discovery mechanisms and can automatically obtain the targets to be collected. You can refer to here. The included service discovery mechanisms include: azure, consul, dns, ec2, openstack, file, gce, kubernetes, marathon, triton, zookeeper (nerve, serverset), for configuration methods, please refer to the Configuration page of the manual. It can be said that the SD mechanism is very rich, but currently due to limited development resources, new SD mechanisms are no longer developed, and only file-based SD mechanisms are maintained. Follow the Linux Chinese community
There are many tutorials on service discovery on the Internet, such as this article Advanced Service Discovery in Prometheus 0.14.0 in the official Prometheus blog. A relatively systematic introduction, comprehensively explaining relabeling configuration and how to use DNS-SRV, Consul and files for service discovery.
In addition, the official website also provides an introductory example of file-based service discovery. The Prometheus workshop introductory tutorial written by Julius Volz also uses DNS-SRV for service discovery.
7.2 Alert configuration management
Whether it is the configuration of Prometheus or the configuration of Alertmanager, there is no API for us to dynamically modify. A very common scenario is that we need to build an alarm system with customizable rules based on Prometheus. Users can create, modify or delete alarm rules on the page according to their own needs, or modify the alarm notification method and contact person, as in Question from this user in Prometheus Google Groups: How to dynamically add alerts rules in rules.conf and prometheus yml file via API or something?
But unfortunately, Simon Pasquier said below that there is currently no such API, and there are no such plans to develop such an API in the future, because such functions should be left to, for example, Puppet and Chef , Ansible, Salt and other configuration management systems.
7.3 Using Pushgateway
Pushgateway is mainly used to collect some short-term jobs. Since such jobs exist for a short time, they may disappear before Prometheus comes to Pull. The official has a good explanation on when to use Pushgateway.
Summary
In the past two years, Prometheus has developed very rapidly, the community is also very active, and more and more people in China are studying Prometheus. With the popularization of concepts such as microservices, DevOps, cloud computing, and cloud native, more and more companies are beginning to use Docker and Kubernetes to build their own systems and applications. Old monitoring systems like Nagios and Cacti will become more and more popular. The less applicable it is, I believe Prometheus will eventually develop into a monitoring system most suitable for cloud environments.
The above is the detailed content of Known as the next generation monitoring system! Let's see how awesome it is. For more information, please follow other related articles on the PHP Chinese website!

Hot AI Tools

Undresser.AI Undress
AI-powered app for creating realistic nude photos

AI Clothes Remover
Online AI tool for removing clothes from photos.

Undress AI Tool
Undress images for free

Clothoff.io
AI clothes remover

Video Face Swap
Swap faces in any video effortlessly with our completely free AI face swap tool!

Hot Article
Hot Tools

SublimeText3 English version
Recommended: Win version, supports code prompts!

MinGW - Minimalist GNU for Windows
This project is in the process of being migrated to osdn.net/projects/mingw, you can continue to follow us there. MinGW: A native Windows port of the GNU Compiler Collection (GCC), freely distributable import libraries and header files for building native Windows applications; includes extensions to the MSVC runtime to support C99 functionality. All MinGW software can run on 64-bit Windows platforms.

ZendStudio 13.5.1 Mac
Powerful PHP integrated development environment

Zend Studio 13.0.1
Powerful PHP integrated development environment

Notepad++7.3.1
Easy-to-use and free code editor

