

 Operation and MaintenanceLinux Operation and MaintenanceLinux network packet capture analysis tool
The tcpdump command can list the headers of data packets passing through the specified network interface, and can completely remove the "headers" of data packets transmitted on the network. Capture it and provide analysis. It supports filtering for network layer, protocol, host, network or port, and provides logical statements such as and, or, not to help you extract useful information.
Because it requires setting the network interface to promiscuous mode, ordinary users cannot execute it normally, but users with root permissions can execute it directly to obtain information on the network
Other packet capture tools
wireshark has both graphical and command line versions, which can analyze the packets captured by tcpdump , its main function is to analyze data packets.
ngrep will directly display the captured packet data in text form, which is suitable for [capture] analysis of packet data containing text (such as HTTP, MySQL )
2. Command options
tcpdump [options] [protocol] [data flow direction] [scope]
-a Convert network address and broadcast address into name
-A Print out all groups in ASCII format and Minimize the header of the link layer
-b Select protocols on the data link layer, including ip/arp/rarp/ipx are all in this layer
-c Specifies the number of times to receive data packets, that is, exit tcpdump after receiving the specified number of data packets
-d Will match the code of the information packet in a human-readable format Assembly format output
-dd Output the code of the matching information packet in the format of c language program segment
-ddd Output the code of the matching information packet in decimal form
-D Print all network interfaces that can be monitored in the system
-e Print the header information of the data link layer on the output line
-f Prints the external Internet address in numerical form, that is, does not display the host name
-F From the specified file Read the expression and ignore other expressions
-i Specify the listening network interface
-l Make the standard output a buffered form, Can export data to a file
-L Lists the known data links of the network interface
-n Does not convert network addresses to names
-N does not output the domain name part of the host name, for example www.baidu.com only outputs www
-nn does not output the port name Conversion
-P Do not set the network interface to promiscuous mode
-q Fast output, that is, only output less protocol information
-r Read data from the specified file, usually -w saved file
-w Save the captured information to file, and does not parse and print to the screen
-
-s read snaplen bytes from each group at the beginning instead of the default 68 bytes
-S Output the tcp sequence number as an absolute value instead of a relative value
-T Directly parse the monitored packets into the specified type of message, common types include rpc (remote procedure call) and snmp (simple network management protocol)
-t Do not print a timestamp in each line of output
-tt Output unformatted timestamp in each line
-ttt Output the time difference between this line and the previous one
-tttt Output the timestamp in the default format of data processing in each line
- ##-u Output the undecoded NFS handle
- -v outputs slightly more detailed information, for example, the ip package can include ttl and service type information
-vv Output the trusted message information
3. tcpdump expression
Keywords about data type
Includes host, port, net:
host 192.168.100.1 represents a host, net 192.168.100.0 represents a network segment, port 80 indicates the port number is 80, if there is no Specify the data type, then the default is host
牛逼啊!接私活必备的 N 个开源项目!赶快收藏
Keywords for data transmission direction
Includes src, dst, dst or src, dst and src, these keywords specify Indicates the direction of transmission, for example, src 192.168.100.1 indicates that the source address of the data packet is 192.168.100.1. dst net 192.168.100.0 indicates that the destination network address is 192.168.100.0. The default is to monitor the src and dst of the host to the host, that is, the default is to monitor all data of the local machine and the target host.
Protocol Keywords
Including ip, arp, rarp, udp
其他关键字
运算类型:or、and、not、!
辅助功能型:gateway、less、broadcast、greater
4、tcpdump 捕获方式
tcpdump [协议类型] [源或目标] [主机名称或 IP] [or/and/not/! 条件组合] [源或目标] [主机名或 IP] [or/and/not/! 条件组合] [端口] [端口号] …… [or/and/not/! 条件组合] [条件]
> tcpdump ip dst 192.168.10.1 and src 192.168.10.10 and port 80 and host !www.baidu.com
tcpdump
默认监听在第一块网卡,监听所有经过此网卡的数据包
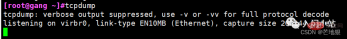
> tcpdump -i ens33
监听指定网卡 ens33 的所有传输数据包
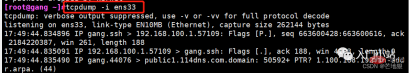
> tcpdump -i ens33 host 192.168.100.10
捕获主机 192.168.100.10 经过网卡 ens33 的所有数据包(也可以是主机名,但要求可以解析出 IP 地址)


第一列:报文的时间
第二列:网络协议 IP
第三列:发送方的 ip 地址、端口号、域名,上图显示的是本机的域名,可通过 / etc/hosts 查看本机域名
第四列:箭头 >, 表示数据流向
第五列:接收方的 ip 地址、端口号、域名,
第六列:冒号
第七列:数据包内容,报文头的摘要信息,有 ttl、报文类型、标识值、序列、包的大小等信息
> tcpdump host 192.168.130.151 and 192.168.130.152or192.168.130.153192.168.130.152or192.168.130.153
捕获主机 192.168.56.209 和主机 192.168.56.210 或 192.168.56.211 的所有通信数据包
> tcpdump ip host node9 and not www.baidu.com
捕获主机 node9 与其他主机之间(不包括 www.baidu.com)通信的 ip 数据包
> tcpdump ip host node9 and ! www.baidu.com
捕获 node9 与其他所有主机的通信数据包(不包括 www.baidu.com)
> tcpdump -i ens33 src node10
捕获源主机 node10 发送的所有的经过 ens33 网卡的所有数据包
> tcpdump -i ens33 dst host www.baidu.com
捕获所有发送到主机 www.baidu.com 的数据包
监听主机 192.168.56.1 和 192.168.56.210 之间 ip 协议的 80 端口的且排除 www.baidu.com 通信的所有数据包:
> tcpdump ip dst 192.168.56.1 and src 192.168.56.210 and port 80 and host ! baidu.com
也可以写成 tcpdump ip dst 192.168.56.1 and src 192.168.56.210 and port 80 and host not www.baidu.com,即 not 和!都是相同的取反的意思
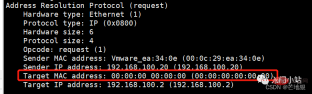
> tcpdump arp
监控指定主机的通信数据包与 1.9.1 方式相同
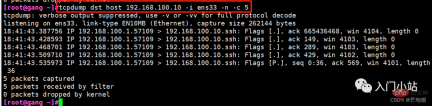
> tcpdump tcp port 22 and host 192.168.56.210
捕获主机 192.168.56.210 接收和发出的 tcp 协议的 ssh 的数据包
tcpdump udp port 53
监听本机 udp 的 53 端口的数据包,udp 是 dns 协议的端口,这也是一个 dns 域名解析的完整过程
5、常用的过滤条件
tcpdump 可以支持逻辑运算符
and: 与运算,所有的条件都需要满足,可用 “and”和 “&&” 表示
or:或运行,只要有一个条件满足就可以,可用 “or” 和“|”表示
not:取反,即取反条件,可以用 “not” 和“!”表示
> tcpdump icmp and src 192.168.100.10 -i ens33 -n
过滤 icmp 报文并且源 IP 是 192.168.100.10
多条件格式
在使用多个过滤条件进行组合时,有可能需要用到括号,而括号在 shell 中是特殊符号,又需要使用引号将其包含。用括号的主要作用是逻辑运算符之间存在优先级,!>and > or, 为例条件能够精确所以需要对一些必要的组合括号括起来,而括号的意思相当于加减运算一样,括起来的内容作为一个整体进行逻辑运算。
过滤源地址是 192.168.100.1 并且目的地址是 192.168.20.20 的数据包或者 ARP 协议的包。另外,搜索公众号Linux就该这样学后台回复“Linux”,获取一份惊喜礼包。

> tcpdump **src** host 192.168.10.10 -i ens33 -n -c 5
过滤源 IP 地址是 192.168.10.10 的包

> tcpdump **dst** host 192.168.10.10 -i ens33 -n -c 5
过滤目的 IP 地址是 192.168.10.10 的包
基于端口进行过滤
> tcpdump port 22 -i ens33 -n -c 5
> 过滤端口号为 22 即 ssh 协议的

> tcpdump portrange 22-433 -i ens33 -n -c 8
过滤端口号 22-433 内的数据包

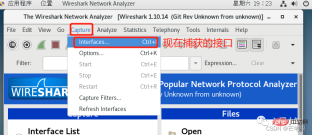
二、wireshark
1、什么是 wireshark
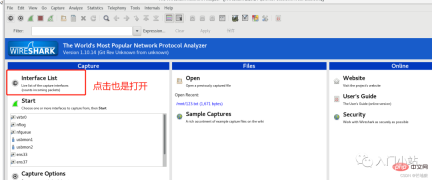
Wireshark 是一个网络封包分析软件。网络封包分析软件的功能是捕获网络数据包,并尽可能显示出最为详细的网络封包资料。Wireshark 使用 WinPCAP 作为接口,直接与网卡进行数据报文交换
2、安装 wireshark
Linux 中有两个版本的 wireshark,一个是 wireshark,这个版本是无图形化界面,基本命令是”tshark“。
一个是 wireshark-gnome(界面版本),这个版本只能安装在支持 GUI 功能的 Linux 的版本中。
> yum -y install wireshark // 安装无图形化版本
> yum -y install wireshark-gnome // 安装图形化版本


注:这里的通过 yum 进行安装,需要提前做好 epel 源(即红帽操作系统额外拓展包),装上了 EPEL 之后,就相当于添加了一个第三方源。官方的 rpm repository 提供的 rpm 包也不够丰富,很多时候需要自己编译那太辛苦了,而 EPEL 可以解决官方 yum 源数据包不够丰富的情况。
安装epel源
> yum -y install epel-release

3、tshark 命令
tshark 是 wireshark 的命令行工具
     tshark 选项 参数
    -i:指定捕获的网卡接口,不设置默认第一个非环回口接口
    -D:显示所有可用的网络接口列表
    -f:指定条件表达式,与 tcpdump 相同
    -s:设置每个抓包的大小,默认 65535,多于这个大小的数据将不会不会被截取。
    -c:捕获指定数量的数据包后退出
    -w:后接文件名,将抓包的结果输出到. pcap 文件中,可以借助其他网络分析工具进行分              析,也可以使用重定向 > 把解码后的输出结果以 txt 的格式输出。
    -p:设置网络接口以非混合模式工作,即只关心和本机有关的流量
    -r:后接文件路径,用于分析保持好的网络包文件,比如 tcpdump 的输出文件
    -n:禁止所有地址名字解析,即禁止域名解析, 默认是允许所有
   -N:指定对某一层的地址名字解析,如果 - n 和 - N 同时存在,则 - n 将被忽略,如果两者都不写,则会默认打开所有地址名字解析
         m:代表数据链路层
         n:代表网络层
         t:代表传输层
    -V:设置将解码结果的细节输出,否则解码结果仅显示一个 packet 一行的 summary
    -t:设置结果的时间格式
         ad:表示带日期的绝对时间
         a:表示不带日期的绝对时间
         r:表示从第一个包到现在的相对时间
         d:表示两个相邻包之间的增量时间
tshark -f "icmp" -i ens33 -V -c 1
过滤 icmp 报文,并展开详细信息。另外,搜索公众号编程技术圈后台回复“1024”,获取一份惊喜礼包。
tshark -f "arp" -i ens33
过滤 arp 报文

4. Graphical interface


3. Tcpdump and wireshark are used together
Tcpdump parses message information without wireshark details , so the data can be captured and output through Tcpdump, and then parsed through wireshark. The output file format is .pcap or other

Read through wireshark on the virtual machine

Use ip.addr == [ip address number] OK Filter out irrelevant IP

Graphic reading

Summary
tcpdump and wireshark are similar in terms of packet capture functions. The command line options of the two are also the same, but tcpdump has the ability to analyze packets. Not very good. At the same time, many Linux systems currently have the tcpdump tool installed built-in, so we can use tcpdump to capture the data packets and store them in our customized files (.pcap), and then extract the files and use wireshark to analyze and troubleshoot.
The above is the detailed content of Linux network packet capture analysis tool. For more information, please follow other related articles on the PHP Chinese website!

 Linux Operations: Utilizing the Maintenance ModeApr 19, 2025 am 12:08 AM
Linux maintenance mode can be entered through the GRUB menu. The specific steps are: 1) Select the kernel in the GRUB menu and press 'e' to edit, 2) Add 'single' or '1' at the end of the 'linux' line, 3) Press Ctrl X to start. Maintenance mode provides a secure environment for tasks such as system repair, password reset and system upgrade.
 Linux: How to Enter Recovery Mode (and Maintenance)Apr 18, 2025 am 12:05 AM
The steps to enter Linux recovery mode are: 1. Restart the system and press the specific key to enter the GRUB menu; 2. Select the option with (recoverymode); 3. Select the operation in the recovery mode menu, such as fsck or root. Recovery mode allows you to start the system in single-user mode, perform file system checks and repairs, edit configuration files, and other operations to help solve system problems.
 Linux's Essential Components: Explained for BeginnersApr 17, 2025 am 12:08 AM
The core components of Linux include the kernel, file system, shell and common tools. 1. The kernel manages hardware resources and provides basic services. 2. The file system organizes and stores data. 3. Shell is the interface for users to interact with the system. 4. Common tools help complete daily tasks.
 Linux: A Look at Its Fundamental StructureApr 16, 2025 am 12:01 AM
The basic structure of Linux includes the kernel, file system, and shell. 1) Kernel management hardware resources and use uname-r to view the version. 2) The EXT4 file system supports large files and logs and is created using mkfs.ext4. 3) Shell provides command line interaction such as Bash, and lists files using ls-l.
 Linux Operations: System Administration and MaintenanceApr 15, 2025 am 12:10 AM
The key steps in Linux system management and maintenance include: 1) Master the basic knowledge, such as file system structure and user management; 2) Carry out system monitoring and resource management, use top, htop and other tools; 3) Use system logs to troubleshoot, use journalctl and other tools; 4) Write automated scripts and task scheduling, use cron tools; 5) implement security management and protection, configure firewalls through iptables; 6) Carry out performance optimization and best practices, adjust kernel parameters and develop good habits.
 Understanding Linux's Maintenance Mode: The EssentialsApr 14, 2025 am 12:04 AM
Linux maintenance mode is entered by adding init=/bin/bash or single parameters at startup. 1. Enter maintenance mode: Edit the GRUB menu and add startup parameters. 2. Remount the file system to read and write mode: mount-oremount,rw/. 3. Repair the file system: Use the fsck command, such as fsck/dev/sda1. 4. Back up the data and operate with caution to avoid data loss.
 How Debian improves Hadoop data processing speedApr 13, 2025 am 11:54 AM
This article discusses how to improve Hadoop data processing efficiency on Debian systems. Optimization strategies cover hardware upgrades, operating system parameter adjustments, Hadoop configuration modifications, and the use of efficient algorithms and tools. 1. Hardware resource strengthening ensures that all nodes have consistent hardware configurations, especially paying attention to CPU, memory and network equipment performance. Choosing high-performance hardware components is essential to improve overall processing speed. 2. Operating system tunes file descriptors and network connections: Modify the /etc/security/limits.conf file to increase the upper limit of file descriptors and network connections allowed to be opened at the same time by the system. JVM parameter adjustment: Adjust in hadoop-env.sh file
 How to learn Debian syslogApr 13, 2025 am 11:51 AM
This guide will guide you to learn how to use Syslog in Debian systems. Syslog is a key service in Linux systems for logging system and application log messages. It helps administrators monitor and analyze system activity to quickly identify and resolve problems. 1. Basic knowledge of Syslog The core functions of Syslog include: centrally collecting and managing log messages; supporting multiple log output formats and target locations (such as files or networks); providing real-time log viewing and filtering functions. 2. Install and configure Syslog (using Rsyslog) The Debian system uses Rsyslog by default. You can install it with the following command: sudoaptupdatesud


Hot AI Tools

Undresser.AI Undress
AI-powered app for creating realistic nude photos

AI Clothes Remover
Online AI tool for removing clothes from photos.

Undress AI Tool
Undress images for free

Clothoff.io
AI clothes remover

AI Hentai Generator
Generate AI Hentai for free.

Hot Article
Hot Tools

Notepad++7.3.1
Easy-to-use and free code editor

SublimeText3 Mac version
God-level code editing software (SublimeText3)

Dreamweaver Mac version
Visual web development tools

WebStorm Mac version
Useful JavaScript development tools

Zend Studio 13.0.1
Powerful PHP integrated development environment

