Suppose you have a set of numbers and you need to find their average. It could be anything, it could be the score on your student roster, it could be the number of visits to your website per month. It's completely impossible to manually calculate the average and populate it into an Excel column. If we have a perfect solution that automates the entire process, you don’t need to prioritize manual operations.
Keep reading to learn how to easily find the average of a group of cells in an Excel worksheet using a quick formula and populate the average of an entire column with a few simple clicks.
Solution
Step 1: Suppose you have a column named AVERAGE whose value needs to be calculated with each student Fill in the corresponding average of the values present in each row.
To do this, first click the first cell of the AVERAGE column .
Then make sure you are in the HOME tab at the top. Next, click the drop-down menu associated with the Sigma button and select Average from the list of options.

Step 2: All values appearing in the row of the selected cell will be automatically considered to calculate the average. In the example screenshot below, the average function auto-populates as =AVERAGE(B2:E2). Here B2:E2 represents all the cells from B2 to E2 in the Excel worksheet.
NOTE: If you need to make any changes, you can always edit the parameter list inside the AVERAGE() function. Suppose if you only need to find the average of cells C3 and D3, then your Average() function would be =AVERAGE(C3, D3). You can also provide static values as parameters in the Average() function. For example, your Average() function could also be =Average(4,87,34,1).

Step 3: Now if you press the Enter key, you can see that the average is calculated successfully. But the decimal point may not be present. If this is the case, right-click the cell and select "Format Cell " from the right-click context menu option.

Step 4: In the Set CellsFormat window, make sure you are in step atab.
Now, under the Category option, click on Number.
To the right of , enter the number of decimal places you want in the decimal placesfiller. I gave 2 in the screenshot below.
Click the OK button after completion.

Step 5: You are here! Average values now also have decimal places visible. If you want to apply the same formula to the rest of the cells in the same column, just click and drag down the little square icon in the lower right corner of the formatted cell.

That’s it. Your formula to find the average of a group of cells is now successfully applied to all cells present in the same column.
The above is the detailed content of How to calculate the average of a set of cells in Microsoft Excel. For more information, please follow other related articles on the PHP Chinese website!
 Excel 发现一个或多个公式引用存在问题:如何修复Apr 17, 2023 pm 06:58 PM
使用错误检查工具使用Excel电子表格查找错误的最快方法之一是使用错误检查工具。如果该工具发现任何错误,您可以更正它们并再次尝试保存文件。但是,该工具可能无法找到所有类型的错误。如果错误检查工具没有发现任何错误或修复它们不能解决问题,那么您需要尝试以下其他修复之一。要在Excel中使用错误检查工具:选择公式 选项卡。单击错误检查 工具。在发现错误时,有关错误原因的信息将出现在工具中。如果不需要,请修复错误或删除导致问题的公式。在错误检查工具中,单击下一步以查看下一个错误并重复该过程。当没
 如何解决在Microsoft Excel中出现内存不足的问题?Apr 22, 2023 am 10:04 AM
MicrosoftExcel是一种流行的程序,用于创建工作表、数据输入操作、创建图形和图表等。它可以帮助用户组织他们的数据并对这些数据进行分析。可以看出,所有版本的Excel应用程序都存在内存问题。许多用户报告说看到错误消息“内存不足,无法运行MicrosoftExcel。请关闭其他应用程序,然后重试。”尝试在他们的WindowsPC上打开Excel时。一旦显示此错误,用户将无法使用MSExcel,因为电子表格将无法打开。一些用户报告在打开从任何电子邮件客户端下载的Excel
 如何在 Excel 中启用或禁用宏Apr 13, 2023 pm 10:43 PM
什么是宏?宏是一组指示 Excel 执行操作或操作序列的指令。它们可以使您免于在 Excel 中执行重复性任务。以最简单的形式,您可以在 Excel 中记录一系列操作并将它们保存为宏。然后,运行您的宏将根据您的需要多次执行相同的操作序列。例如,您可能希望在文档中插入多张工作表。一次插入一个并不理想,但宏可以通过一遍又一遍地重复相同的步骤来插入任意数量的工作表。通过使用 Visu
 如何在 Microsoft Excel 中显示开发人员选项卡Apr 14, 2023 pm 02:10 PM
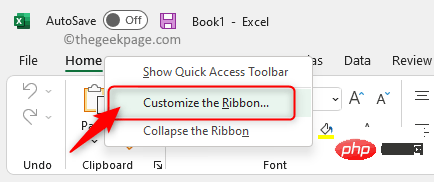
如果您需要录制或运行宏、插入 Visual Basic 表单或 ActiveX 控件或在 MS Excel 中导入/导出 XML 文件,则需要 Excel 中的“开发人员”选项卡以便轻松访问。但是,默认情况下,此开发人员选项卡不会显示,但您可以通过在 Excel 选项中启用它来将其添加到功能区。如果您正在使用宏和 VBA 并希望从功能区轻松访问它们,请继续阅读这篇文章。在 Excel 中启用开发人员选项卡的步骤1. 启动MS Excel应用程序。右键单击顶部功能区选项卡之一的任意位置,然后在出现
 在 Excel 中如何查找并删除合并单元格Apr 20, 2023 pm 11:52 PM
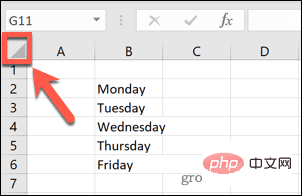
如何在Windows上的Excel中查找合并的单元格在从数据中删除合并的单元格之前,您需要全部找到它们。使用Excel的查找和替换工具很容易做到这一点。在Excel中查找合并的单元格:突出显示要在其中查找合并单元格的单元格。要选择所有单元格,请单击电子表格左上角的空白区域或按Ctrl+A。单击主页选项卡。单击查找和选择图标。选择查找。单击选项按钮。在FindWhat设置的末尾,单击Format。在对齐选项卡下,单击合并单元格。它应该包含一个复选标记而不是一行。单击确定以确认格式
 如何计算 Google 表格上的日期之间的差异Apr 19, 2023 pm 08:07 PM
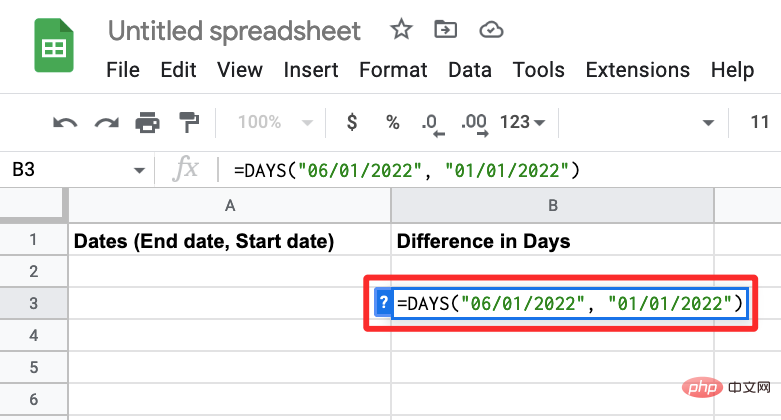
如果您的任务是处理包含大量日期的电子表格,那么计算多个日期之间的差异可能会非常令人沮丧。虽然最简单的选择是依靠在线日期计算器,但它可能不是最方便的,因为您可能必须将日期一一输入到在线工具中,然后手动将结果复制到电子表格中。 对于大量日期,您需要一个更方便地完成工作的工具。幸运的是,谷歌表格允许用户在本地计算电子表格中两个日期之间的差异。在这篇文章中,我们将使用一些内置函数帮助您计算Google表格上两个日期之间的天数。 如何计算Google表格上的日期之间的差异如果您希望Google
 如何在 Windows 11 上创建自定义电源计划Apr 28, 2023 am 11:34 AM
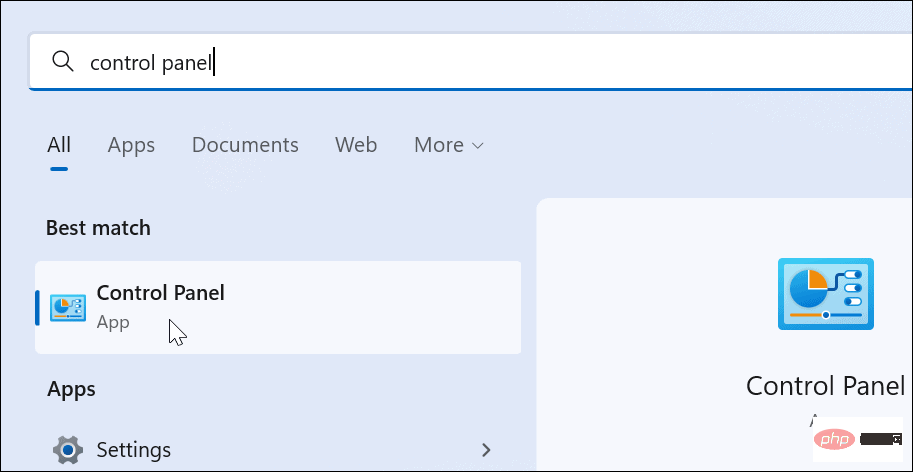
如何在Windows11上创建自定义电源计划自定义电源计划允许您确定Windows如何对不同情况作出反应。例如,如果您希望显示器在一段时间后关闭,但又不想让它进入睡眠状态,您可以创建一个自定义计划来执行此操作。在Windows11上创建自定义电源计划:打开开始菜单并键入控制面板。从搜索结果中选择控制面板。在控制面板中,将查看方式选项更改为大图标。接下来,选择电源选项。单击电源选项菜单中的创建电源计划选项。从提供的选项中选择您要使用的基本电源计划。在底部的计划名称字段中为其指定一个描述性名
 如何压缩 Excel 文件大小?Apr 21, 2023 pm 03:01 PM
如何通过删除工作表来减小Excel中的文件大小在Excel中使用多个工作表可以更轻松地构建电子表格,但使用的工作表越多,文件越大。删除不需要的工作表有助于减小文件大小。在Excel中删除工作表:确保您要删除的工作表不包含其他工作表需要或引用的任何数据。右键单击屏幕底部的工作表选项卡。选择删除。该工作表将被删除-对您要删除的任何其他工作表重复这些步骤。清除数据透视表缓存Excel中的数据透视表是分析数据的好方法,但它们会对Excel文件的大小产生重大影响。这是因为,默认情况下

Hot AI Tools

Undresser.AI Undress
AI-powered app for creating realistic nude photos

AI Clothes Remover
Online AI tool for removing clothes from photos.

Undress AI Tool
Undress images for free

Clothoff.io
AI clothes remover

AI Hentai Generator
Generate AI Hentai for free.

Hot Article

Hot Tools

Dreamweaver Mac version
Visual web development tools

MantisBT
Mantis is an easy-to-deploy web-based defect tracking tool designed to aid in product defect tracking. It requires PHP, MySQL and a web server. Check out our demo and hosting services.

Notepad++7.3.1
Easy-to-use and free code editor

SAP NetWeaver Server Adapter for Eclipse
Integrate Eclipse with SAP NetWeaver application server.

SublimeText3 Mac version
God-level code editing software (SublimeText3)


