


In web applications and business software, data visualization and report generation are essential functions. They help people better understand and analyze data to make better decisions. PHP is a widely used programming language that provides a variety of libraries and tools that make data visualization and report generation easier and more efficient. This article will introduce how to perform data visualization and report generation in PHP.
1. Use Chart.js for data visualization
Chart.js is a lightweight, user-friendly, flexible and configurable JavaScript chart library that can be easily Integrated with PHP. It supports many types of charts, such as line charts, bar charts, pie charts, scatter charts, etc. It can accept JSON data generated by PHP and convert it into various charts.
The following is a sample code for using Chart.js to generate a histogram:
<!DOCTYPE html>
<html>
<head>
    <title>Bar Chart</title>
    <script src="https://cdn.jsdelivr.net/npm/chart.js"></script>
</head>
<body>
    <canvas id="myChart"></canvas>
    <?php
      // generate data
      $data = [
        "January" => 50,
        "February" => 65,
        "March" => 80,
        "April" => 90,
        "May" => 100,
        "June" => 75,
        "July" => 60
      ];
    ?>
    <script>
        var data = <?php echo json_encode($data); ?>;
        var labels = Object.keys(data);
        var values = Object.values(data);

        var ctx = document.getElementById('myChart').getContext('2d');
        var myChart = new Chart(ctx, {
            type: 'bar',
            data: {
                labels: labels,
                datasets: [{
                    label: 'Months',
                    data: values,
                    backgroundColor: 'rgba(255, 99, 132, 0.2)',
                    borderColor: 'rgba(255,99,132,1)',
                    borderWidth: 1
                }]
            },
            options: {
                scales: {
                    yAxes: [{
                        ticks: {
                            beginAtZero:true
                        }
                    }]
                }
            }
        });
    </script>
</body>
</html>
In this example, we generated a histogram representing sales for seven months. $data is a PHP array containing seven months of data. In the JavaScript code, we use the json_encode() function to convert the PHP array into JSON format data, and then generate the chart through the Chart.js library.
2. Use FPDF library for report generation
FPDF is a lightweight PHP library used to generate PDF files. It can generate various types of documents such as reports, certificates, invoices, contracts, etc. It provides rich text formatting, table and image support. What's more, it's free and runs on any server.
The following is a sample code for using FPDF to generate a simple report:
<?php
require('fpdf/fpdf.php');

$pdf = new FPDF();
$pdf->AddPage();
$pdf->SetFont('Arial','B',16);
$pdf->Cell(40,10,'Hello World!');
$pdf->Output();
?>
In this example, we create a new PDF file, add a page, and set the Arial font, 16 point font and bold style. Then, we added a text cell using the Cell() method, where the first parameter is the cell width, the second parameter is the cell height, and the third parameter is the cell text content. Finally, call the Output() method to generate the PDF file.
3. Use the PHPlot library to generate charts and graphics
PHPlot is a PHP library used to generate various types of charts and graphics. It can generate many types of charts, such as linear charts, bar charts, pie charts, etc. It also supports generating various types of graphs, such as line graphs, bar graphs, etc. PHPlot is also a free library and can run on any server.
The following is an example code for using PHPlot to generate a simple line chart:
<?php
require_once 'phplot/phplot.php';

$plot = new PHPlot(800, 600);
$plot->SetTitle('Monthly Sales Report');
$plot->SetXTitle('Months');
$plot->SetYTitle('Sales');
$plot->SetPlotType('lines');
$plot->SetDataType('text-data');

$months = array('January', 'February', 'March', 'April', 'May', 'June', 'July');
$sales = array(50, 65, 80, 90, 100, 75, 60);

$data = array();
for ($i=0; $i<7; $i++) {
  $data[] = array($months[$i], $sales[$i]);
}

$plot->SetDataValues($data);
$plot->DrawGraph();
?>
In this example, we create a PHPlot object and set the title, horizontal axis and vertical axis. Label. Then we defined two arrays, $months and $sales, representing seven months and sales respectively. Next, we convert the two arrays into a two-dimensional array $data, and set the data of the PHPlot object through the SetDataValues() method. Finally, we call the DrawGraph() method to draw the line chart.
Conclusion
PHP provides a variety of libraries and tools to make data visualization and report generation easier and more efficient. Whether you use Chart.js, FPDF or PHPlot, you can easily achieve your data visualization and report generation needs. We can choose the most suitable libraries and tools according to the actual situation, and deeply study and apply the functions they provide.
The above is the detailed content of How to do data visualization and report generation in PHP?. For more information, please follow other related articles on the PHP Chinese website!

 一文详解Python数据分析模块Numpy切片、索引和广播Apr 10, 2023 pm 02:56 PM
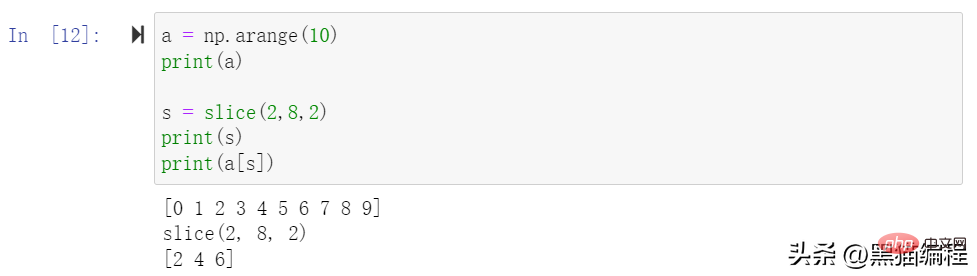
Numpy切片和索引ndarray对象的内容可以通过索引或切片来访问和修改,与 Python 中 list 的切片操作一样。ndarray 数组可以基于 0 ~ n-1 的下标进行索引,切片对象可以通过内置的 slice 函数,并设置 start, stop 及 step 参数进行,从原数组中切割出一个新数组。切片还可以包括省略号 …,来使选择元组的长度与数组的维度相同。 如果在行位置使用省略号,它将返回包含行中元素的 ndarray。高级索引整数数组索引以下实例获取数组中 (0,0),(1,1
 如何利用 Go 语言进行数据分析和机器学习?Jun 10, 2023 am 09:21 AM
随着互联网技术的发展和大数据的普及,越来越多的公司和机构开始关注数据分析和机器学习。现在,有许多编程语言可以用于数据科学,其中Go语言也逐渐成为了一种不错的选择。虽然Go语言在数据科学上的应用不如Python和R那么广泛,但是它具有高效、并发和易于部署等特点,因此在某些场景中表现得非常出色。本文将介绍如何利用Go语言进行数据分析和机器学习
 Python中的机器学习是什么?Jun 04, 2023 am 08:52 AM
近年来,机器学习(MachineLearning)成为了IT行业中最热门的话题之一,Python作为一种高效的编程语言,已经成为了许多机器学习实践者的首选。本文将会介绍Python中机器学习的概念、应用和实现。一、机器学习概念机器学习是一种让机器通过对数据的分析、学习和优化,自动改进性能的技术。其主要目的是让机器能够在数据中发现存在的规律,从而获得对未来
 数据挖掘和数据分析的区别是什么?Dec 07, 2020 pm 03:16 PM
区别:1、“数据分析”得出的结论是人的智力活动结果,而“数据挖掘”得出的结论是机器从学习集【或训练集、样本集】发现的知识规则;2、“数据分析”不能建立数学模型,需要人工建模,而“数据挖掘”直接完成了数学建模。
 Python量化交易实战:获取股票数据并做分析处理Apr 15, 2023 pm 09:13 PM
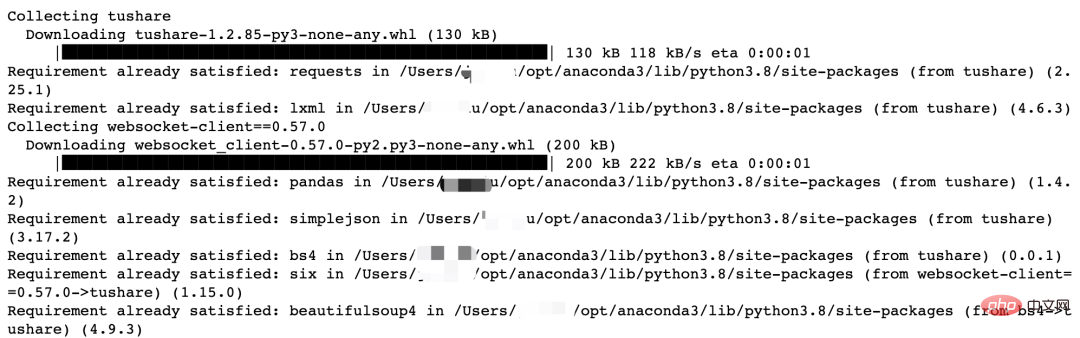
量化交易(也称自动化交易)是一种应用数学模型帮助投资者进行判断,并且根据计算机程序发送的指令进行交易的投资方式,它极大地减少了投资者情绪波动的影响。量化交易的主要优势如下:快速检测客观、理性自动化量化交易的核心是筛选策略,策略也是依靠数学或物理模型来创造,把数学语言变成计算机语言。量化交易的流程是从数据的获取到数据的分析、处理。数据获取数据分析工作的第一步就是获取数据,也就是数据采集。获取数据的方式有很多,一般来讲,数据来源主要分为两大类:外部来源(外部购买、网络爬取、免费开源数据等)和内部来源
 MySQL中的大数据分析技巧Jun 14, 2023 pm 09:53 PM
随着大数据时代的到来,越来越多的企业和组织开始利用大数据分析来帮助自己更好地了解其所面对的市场和客户,以便更好地制定商业策略和决策。而在大数据分析中,MySQL数据库也是经常被使用的一种工具。本文将介绍MySQL中的大数据分析技巧,为大家提供参考。一、使用索引进行查询优化索引是MySQL中进行查询优化的重要手段之一。当我们对某个列创建了索引后,MySQL就可
 AI牵引工业软件新升级,数据分析与人工智能在探索中进化Jun 05, 2023 pm 04:04 PM
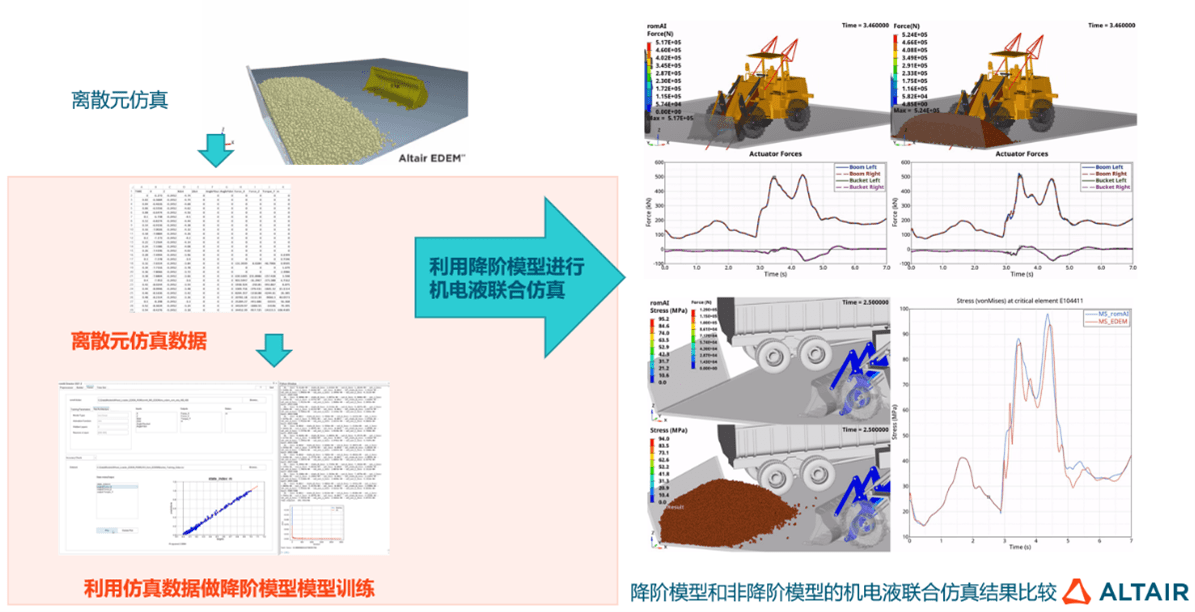
CAE和AI技术双融合已成为企业研发设计环节数字化转型的重要应用趋势,但企业数字化转型绝不仅是单个环节的优化,而是全流程、全生命周期的转型升级,数据驱动只有作用于各业务环节,才能真正助力企业持续发展。数字化浪潮席卷全球,作为数字经济核心驱动,数字技术逐步成为企业发展新动能,助推企业核心竞争力进化,在此背景下,数字化转型已成为所有企业的必选项和持续发展的前提,拥抱数字经济成为企业的共同选择。但从实际情况来看,面向C端的产业如零售电商、金融等领域在数字化方面走在前列,而以制造业、能源重工等为代表的传
 为何军事人工智能初创公司近年来备受追捧Apr 13, 2023 pm 01:34 PM
俄乌冲突爆发 2 周后,数据分析公司 Palantir 的首席执行官亚历山大·卡普 (Alexander Karp) 向欧洲领导人提出了一项建议。在公开信中,他表示欧洲人应该在硅谷的帮助下实现武器现代化。Karp 写道,为了让欧洲“保持足够强大以战胜外国占领的威胁”,各国需要拥抱“技术与国家之间的关系,以及寻求摆脱根深蒂固的承包商控制的破坏性公司与联邦政府部门之间的资金关系”。而军队已经开始响应这项号召。北约于 6 月 30 日宣布,它正在创建一个 10 亿美元的创新基金,将投资于早期创业公司和


Hot AI Tools

Undresser.AI Undress
AI-powered app for creating realistic nude photos

AI Clothes Remover
Online AI tool for removing clothes from photos.

Undress AI Tool
Undress images for free

Clothoff.io
AI clothes remover

AI Hentai Generator
Generate AI Hentai for free.

Hot Article
Hot Tools

Dreamweaver Mac version
Visual web development tools

SublimeText3 Linux new version
SublimeText3 Linux latest version

SublimeText3 Chinese version
Chinese version, very easy to use

SublimeText3 English version
Recommended: Win version, supports code prompts!

ZendStudio 13.5.1 Mac
Powerful PHP integrated development environment

