Home >Backend Development >Python Tutorial >What are the common ways to use the plt.scatter() function in Python?
What are the common ways to use the plt.scatter() function in Python?
- PHPzforward
- 2023-05-12 16:43:175383browse
plt.scatter() function usage
1.scatter() function definition
matplotlib.pyplot.scatter(x, y, s=None, c=None, marker= None, cmap=None, norm=None, vmin=None, vmax=None, alpha=None, linewidths=None, verts=None, edgecolors=None, *, data=None, **kwargs)
| Eigenvalue | Function |
|---|---|
| x, y | draw a scatter plot Data point (X, Y) |
| s | A parameter used to adjust the size of the marker |
| c | represents color. The default is blue’b’, which represents the color of the mark, or it can be a character representing the color, or a sequence of length n representing the color, etc. For example, ‘b’=blue, ‘y’ =yellow, ‘k’=black, etc. |
| marker | represents the style of the mark, and the default is ’o’. |
| cmap | Colormap entity or the name of a colormap, cmap is only used when c is an array of floating point numbers. If there is no declaration, it is the image.cmap |
| norm | Normalize entity to convert the data brightness to between 0-1, and only c is an array of floating point numbers. Use only when needed. If not declared, it defaults to colors.Normalize. |
| vmin,vmax | Real numbers, ignored when norm exists. Used to normalize brightness data. |
| alpha | Real number, between 0-1. Used to adjust the transparency of the mark. The default is 1 |
| linewidths | , which is the length of the mark point. |
2. Usage of scatter() function
import numpy as np
import matplotlib.pyplot as plt

plt.rcParams['font.sans-serif']=['simhei']  #标题字体
plt.title('scatter测试图')     #图片标题
np.random.seed(1) #使用相同的seed()值,则每次生成的随即数都相同
x = np.random.rand(5)
y = np.random.rand(5) #随机生成5个x,y的值

colors = np.array([1,0,0,1,1]) #颜色标签列表
area = 20*10    #可以自行调节大小
lines=np.zeros(10)+5
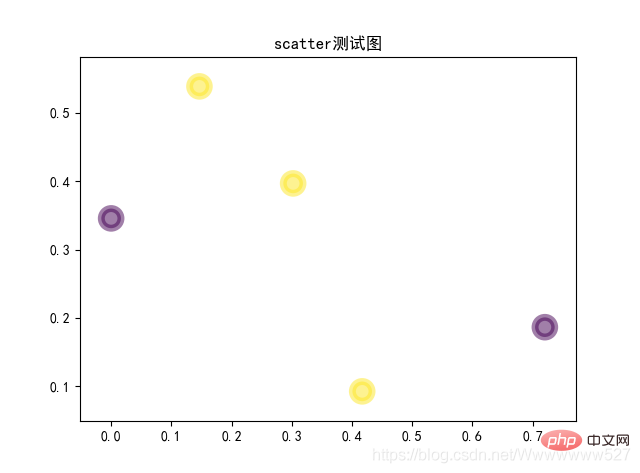
plt.scatter(x, y, s=area,c=colors, alpha=0.5,linewidths=lines)
plt.show()
Output
Output:
Picture:

You can also change the style of the market tag
import numpy as np
import matplotlib.pyplot as plt

plt.rcParams['font.sans-serif']=['simhei']  #标题字体
plt.title('scatter测试图')     #图片标题
np.random.seed(1)   #使用相同的seed()值,则每次生成的随即数都相同
x = np.random.rand(5)
y = np.random.rand(5)

colors = np.array([1,0,0,1,1])
area = 20*10
lines=np.zeros(10)+5
plt.scatter(x, y, s=area,c=colors,marker='x')
plt.show()

The above is the detailed content of What are the common ways to use the plt.scatter() function in Python?. For more information, please follow other related articles on the PHP Chinese website!
Statement:
This article is reproduced at:yisu.com. If there is any infringement, please contact admin@php.cn delete
Previous article:How to use Python timerNext article:How to use Python timer

