Home >Backend Development >Python Tutorial >How to use Python point cloud to generate 3D mesh
How to use Python point cloud to generate 3D mesh
- WBOYWBOYWBOYWBOYWBOYWBOYWBOYWBOYWBOYWBOYWBOYWBOYWBforward
- 2023-05-12 14:28:062042browse
1. Introduction
PointCloud is a collection of points with 3-axis coordinates (x, y, z). This type of collection can come from different sources and be saved in different formats. Point clouds can be converted into 3D meshes using different algorithms called surface reconstruction algorithms. To perform surface reconstruction, this guide uses PyVista, an easy-to-use library for working with 3D data.
To install the latest version of PyVista from PyPI, please use:
pip install pyvistaa
2. Program
The code to generate the grid is very short. You just need to provide a NumPy array of shape N × 3, where N is the number of points and the three columns are the x position, y position, and z position of each point. The most challenging part of the process is getting the point cloud of the object of interest, because once you have it, the full code to generate the mesh is very short:
import numpy as np
import pyvista as pv
# NumPy array with shape (n_points, 3)
points = np.genfromtxt('points.csv', delimiter=",", dtype=np.float32)

point_cloud = pv.PolyData(points)
mesh = point_cloud.reconstruct_surface()
mesh.save('mesh.stl')
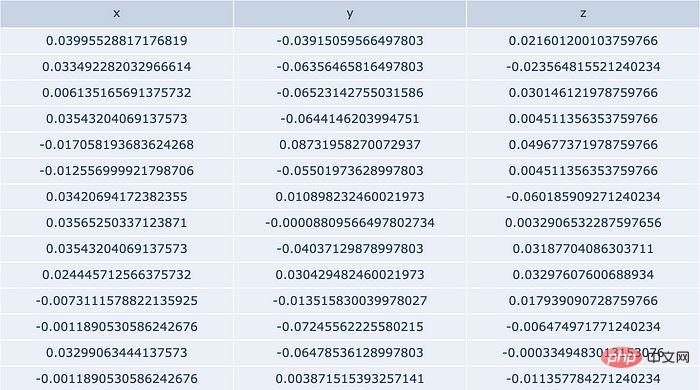
In this example, the point cloud is obtained from Extracted from a CSV file in the following format:

No matter where your points come from, the important thing is that pv.PolyData(points) is passed to the method in the format mentioned above NumPy arrays.
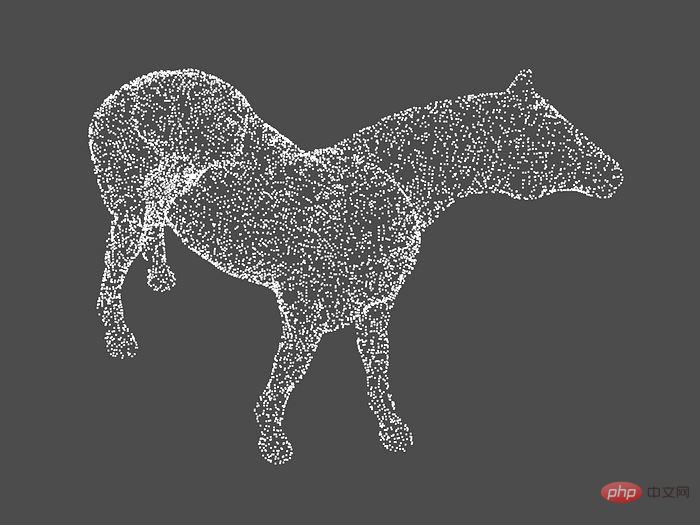
If you want to visualize point clouds use:
point_cloud.plot(eye_dome_lighting= True )
Eye Dome Illumination is a shading technique that improves depth perception when visualizing point clouds.

Example of point cloud visualization. Source files from PyVista examples.
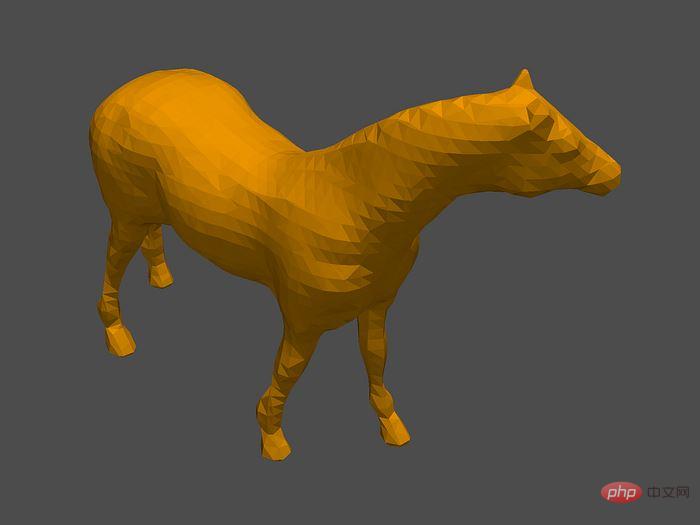
If you want to visualize the resulting grid, use:
mesh.plot(color='orange')

Example of grid visualization. Source files from PyVista examples.

The above is the detailed content of How to use Python point cloud to generate 3D mesh. For more information, please follow other related articles on the PHP Chinese website!

