Home >Java >javaTutorial >How to use Spring Boot to monitor SQL running status
How to use Spring Boot to monitor SQL running status
- PHPzforward
- 2023-05-11 17:13:061827browse
1. Preparation work
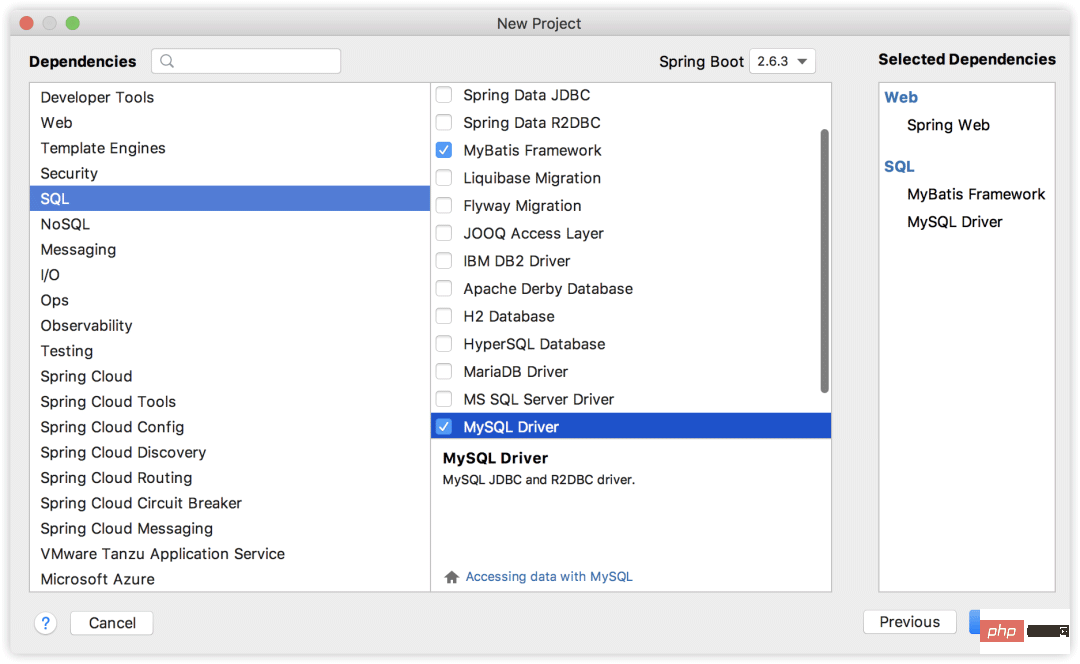
First we create a Spring Boot project, introduce MyBatis, etc., as follows:

First connect to the database:
spring.datasource.username=root
spring.datasource.password=123
spring.datasource.url=jdbc:mysql:///test05?serverTimezone=Asia/Shanghai
Create a User entity class and make a simple query case, as follows:
public class User {
    private Integer id;
    private String username;
    private String address;
    private String password;
    private String email;
    //省略 getter/setter
}
@Mapper
public interface UserMapper {
    List<User> getUserByUsername(String username);
}
@Service
public class UserService {
    @Autowired
    UserMapper userMapper;
    public List<User> getUserByUsername(String username){
        return userMapper.getUserByUsername(username);
    }
}
@RestController
public class UserController {
    @Autowired
    UserService userService;

    @GetMapping("/user")
    public List<User> getUser(String username) {
        return userService.getUserByUsername(username);
    }
}
UserMapper.xml is as follows:
<!DOCTYPE mapper
        PUBLIC "-//mybatis.org//DTD Mapper 3.0//EN"
        "http://mybatis.org/dtd/mybatis-3-mapper.dtd">
<mapper namespace="org.javaboy.druid_monitor.mapper.UserMapper">
    <select id="getUserByUsername" resultType="org.javaboy.druid_monitor.model.User">
        select * from user where username=#{username}
    </select>
</mapper>
A very simple test, there is nothing to say. You can build this environment as you like. If you already have a persistence case, just go to the second section to introduce Druid. The default database connection pool used by this project is HikariDataSource, which is the default database connection pool in Spring Boot. In fact, this is not bad. 2. Introducing DruidNext we introduce Druid: <dependency>
<groupId>com.alibaba</groupId>
<artifactId>druid-spring-boot-starter</artifactId>
<version>1.2.8</version>
</dependency>
Note:The Druid introduced by Spring Boot is the above one, which will be configured for monitoring in the future It is more convenient.
Next we configure WebStatFilter in application.properties. WebStatFilter is used to collect web-jdbc related monitoring data:# 启用 WebStatFilter spring.datasource.druid.web-stat-filter.enabled=true # 配置拦截规则 spring.datasource.druid.web-stat-filter.url-pattern=/* # 排除一些不必要的 url,这些 URL 不会涉及到 SQL 查询 spring.datasource.druid.web-stat-filter.exclusions=*.js,*.gif,*.jpg,*.png,*.css,*.ico,/druid/* # 开启 session 统计功能 spring.datasource.druid.web-stat-filter.session-stat-enable=true # 缺省 sessionStatMaxCount 是 1000 个,我们可以按需要进行配置 spring.datasource.druid.web-stat-filter.session-stat-max-count=1000 # 配置 principalSessionName,使得 druid 能够知道当前的 session 的用户是谁 # 根据需要,这个参数的值是 user 信息保存在 session 中的 sessionName #spring.datasource.druid.web-stat-filter.principal-session-name= # 下面这个配置的作用和上面配置的作用类似,这个是通过 Cookie 来识别用户 #spring.datasource.druid.web-stat-filter.principal-cookie-name= # 开启 profile 后就能够监控单个 URL 地址调用列表 #spring.datasource.druid.web-stat-filter.profile-enable=We only need to configure the first five, but the last three are not required. Configuration, the meaning of each configuration has been listed in the code by Songge.
Next, open the configuration of StatViewServlet, as follows:
# 启用内置的监控页面
spring.datasource.druid.stat-view-servlet.enabled=true
# 内置监控页面的地址
spring.datasource.druid.stat-view-servlet.url-pattern=/druid/*
# 开启 Reset All 功能
spring.datasource.druid.stat-view-servlet.reset-enable=true
# 设置登录用户名
spring.datasource.druid.stat-view-servlet.login-username=javaboy
# 设置登录密码
spring.datasource.druid.stat-view-servlet.login-password=123
# 白名单(如果allow没有配置或者为空,则允许所有访问)
spring.datasource.druid.stat-view-servlet.allow=127.0.0.1
# 黑名单(deny 优先于 allow,如果在 deny 列表中,就算在 allow 列表中,也会被拒绝)
spring.datasource.druid.stat-view-servlet.deny=
Configure the page address and configure the black and white list.
It should be noted that even if the reset-enable attribute is set to false, the reset button will be displayed. Just clicking the button will not reset it.
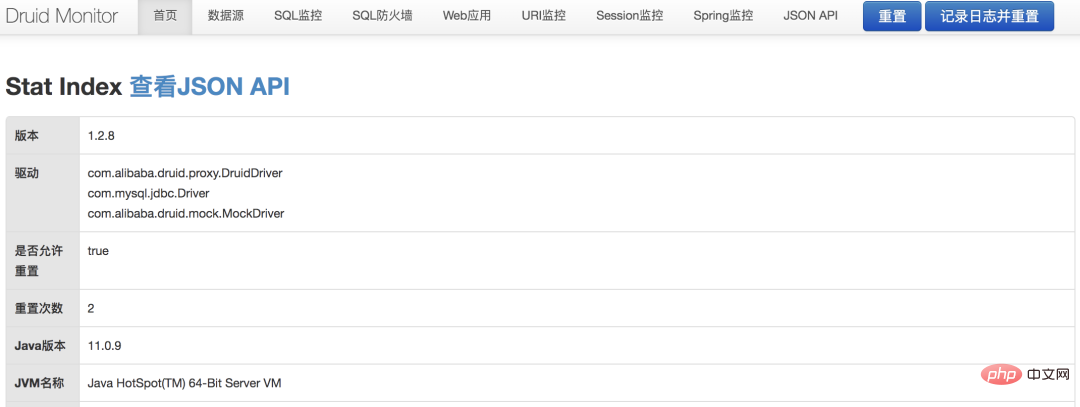
Okay, that's it. 3. TestOkay, next we start the Spring Boot project for testing. After the Spring Boot project is successfully started, first visit the following address: http://localhost:8080/druid/login.htmlAt this time we will see the login authentication page, As follows:


http://localhost:8080/user?username=aaa address and execute a SQL. After the execution is completed, we check the SQL monitoring:


druid-1.2.8.jar!/support/http/resources/js/ common.js Here, the common.js file contains the following lines:
init : function() {
 this.buildFooter();
 druid.lang.init();
},
buildFooter : function() {
 var html ='';
 $(document.body).append(html);
},
The logic is probably as above, the buildFooter method is responsible for building the advertisement at the end of the page, and the call to the buildFooter method is completed in the init method . If you want to remove ads, just don’t call the buildFooter method. So our idea of removing advertising is also very simple. Write a filter, intercept the request to common.js, and then make a little modification, as follows: @WebFilter(urlPatterns = "/druid/js/common.js")
public class RemoveAdFilter implements Filter {
@Override
public void doFilter(ServletRequest servletRequest, ServletResponse servletResponse, FilterChain filterChain) throws IOException, ServletException {
String text = Utils.readFromResource("support/http/resources/js/common.js");
text = text.replace("this.buildFooter();", "");
servletResponse.getWriter().write(text);
}
}As you can see, this The filter is to intercept the /druid/js/common.js request. After intercepting it, read the common.js file in the file yourself, and then manually replace it this.buildFooter(); This sentence is enough, just write the file out at the end.
Of course, remember to scan Filter in the startup class, as follows:
@SpringBootApplication
@ServletComponentScan("org.javaboy.druid_monitor.filter")
public class DruidMonitorApplication {

    public static void main(String[] args) {
        SpringApplication.run(DruidMonitorApplication.class, args);
    }
}
The above is the detailed content of How to use Spring Boot to monitor SQL running status. For more information, please follow other related articles on the PHP Chinese website!
Related articles
See more- How Can AtomicInteger Enhance Concurrent Programming in Java?
- How to set margins for buttons inside a LinearLayout programmatically?
- How to Generate Non-Deterministic Random Numbers in Java When Using a Fixed Seed?
- Why and How Should You Synchronize on String Objects in Java?
- How Can I Load Java Resources from the Classpath Using a Custom URLStreamHandler?

