


As data analysis becomes more and more popular, people begin to pay attention to how to better present data for better understanding. Data visualization is an emerging technology that transforms data into easy-to-understand charts, images, and graphs.
Highmaps is a js library specifically designed for creating interactive maps. It has good visualization effects and an easy-to-use API, providing developers with an excellent toolbox. Combined with PHP, we can easily create map data visualization charts.
Here are the steps to create a map data visualization chart:
- Preparing map data
The Highmaps library requires a set of map data to create a map. The data can be GeoJSON files, TopoJSON files or JS objects. You can download it from the Highmaps official website or obtain it yourself from other sources.
- Prepare the data that needs to be visualized
The data needs to be converted into a format that Highmaps can understand. Visualization data should contain a unique key and attribute values that distinguish geographic locations. For example, for a global map, you can use the country's ISO code as the key value and the data that needs to be displayed as the attribute value.
- Use PHP to convert visual data to JSON format
Since the visual data format required by Highmaps is JSON format, we need to convert it to JSON format. Use PHP to write scripts to extract and format data into JSON format. The final JSON should contain a "data" attribute containing the map data to be displayed.
- Create a Highmaps map instance
Introduce the Highmaps library into the HTML page. Then, use Highmaps' API to create a map instance. Initializes the map's properties such as magnification level, geographic center, etc. using map data and settings.
- Bind the visualization data to the map instance
Bind the JSON data provided in step 3 to the map instance. Use the series property of Highmaps to add a data layer. Set the properties of the data layer, such as the range of data values, color, etc.
- Rendering map
Use the renderTo method provided by Highmaps to render the map onto the HTML page.
After completing the above steps, you can see the results of the data visualization chart. Highmaps provides various types of map visualization charts, such as scatter plots, heat maps, etc. In addition, Highmaps also provides various interactive methods, such as zooming, panning, information prompts, etc.
By combining PHP and Highmaps, we can easily create interactive map data visualization charts, which will bring deeper knowledge and better understanding to data analysis.
The above is the detailed content of Create map data visualization charts using PHP and Highmaps. For more information, please follow other related articles on the PHP Chinese website!

 Working with Flash Session Data in LaravelMar 12, 2025 pm 05:08 PM
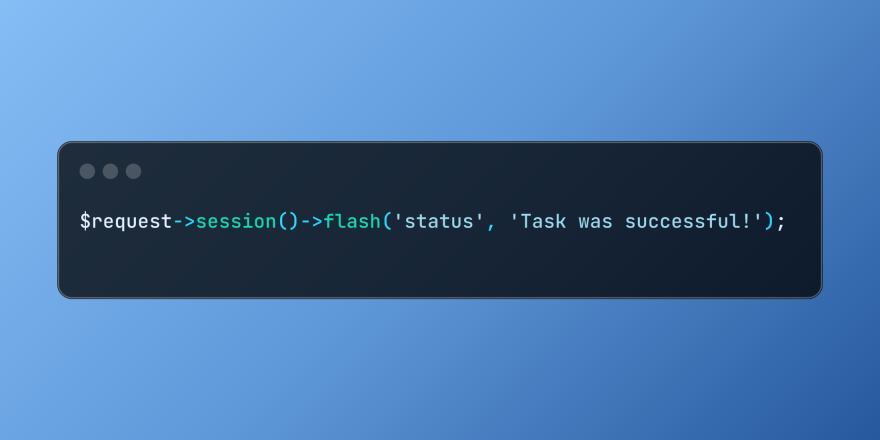
Laravel simplifies handling temporary session data using its intuitive flash methods. This is perfect for displaying brief messages, alerts, or notifications within your application. Data persists only for the subsequent request by default: $request-
 cURL in PHP: How to Use the PHP cURL Extension in REST APIsMar 14, 2025 am 11:42 AM
The PHP Client URL (cURL) extension is a powerful tool for developers, enabling seamless interaction with remote servers and REST APIs. By leveraging libcurl, a well-respected multi-protocol file transfer library, PHP cURL facilitates efficient execution of various network protocols, including HTTP, HTTPS, and FTP. This extension offers granular control over HTTP requests, supports multiple concurrent operations, and provides built-in security features.
 Simplified HTTP Response Mocking in Laravel TestsMar 12, 2025 pm 05:09 PM
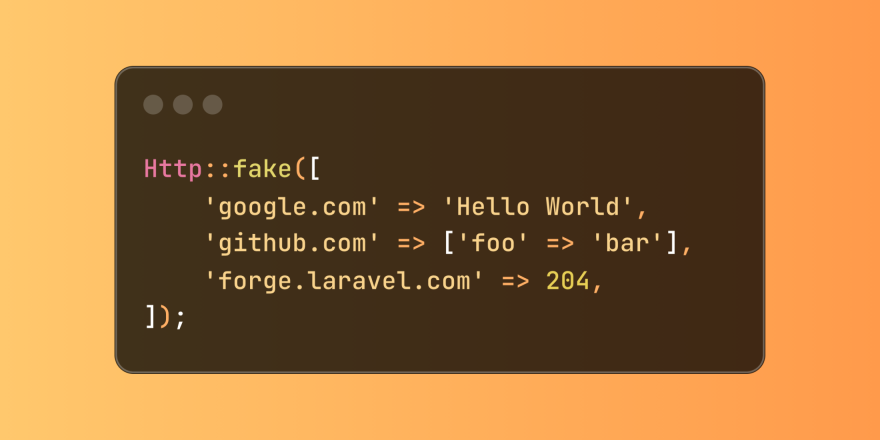
Laravel provides concise HTTP response simulation syntax, simplifying HTTP interaction testing. This approach significantly reduces code redundancy while making your test simulation more intuitive. The basic implementation provides a variety of response type shortcuts: use Illuminate\Support\Facades\Http; Http::fake([ 'google.com' => 'Hello World', 'github.com' => ['foo' => 'bar'], 'forge.laravel.com' =>
 How to Register and Use Laravel Service ProvidersMar 07, 2025 am 01:18 AM
Laravel's service container and service providers are fundamental to its architecture. This article explores service containers, details service provider creation, registration, and demonstrates practical usage with examples. We'll begin with an ove
 12 Best PHP Chat Scripts on CodeCanyonMar 13, 2025 pm 12:08 PM
Do you want to provide real-time, instant solutions to your customers' most pressing problems? Live chat lets you have real-time conversations with customers and resolve their problems instantly. It allows you to provide faster service to your custom
 PHP Logging: Best Practices for PHP Log AnalysisMar 10, 2025 pm 02:32 PM
PHP logging is essential for monitoring and debugging web applications, as well as capturing critical events, errors, and runtime behavior. It provides valuable insights into system performance, helps identify issues, and supports faster troubleshoot
 Explain the concept of late static binding in PHP.Mar 21, 2025 pm 01:33 PM
Article discusses late static binding (LSB) in PHP, introduced in PHP 5.3, allowing runtime resolution of static method calls for more flexible inheritance.Main issue: LSB vs. traditional polymorphism; LSB's practical applications and potential perfo
 Customizing/Extending Frameworks: How to add custom functionality.Mar 28, 2025 pm 05:12 PM
The article discusses adding custom functionality to frameworks, focusing on understanding architecture, identifying extension points, and best practices for integration and debugging.


Hot AI Tools

Undresser.AI Undress
AI-powered app for creating realistic nude photos

AI Clothes Remover
Online AI tool for removing clothes from photos.

Undress AI Tool
Undress images for free

Clothoff.io
AI clothes remover

AI Hentai Generator
Generate AI Hentai for free.

Hot Article
Hot Tools

SAP NetWeaver Server Adapter for Eclipse
Integrate Eclipse with SAP NetWeaver application server.

EditPlus Chinese cracked version
Small size, syntax highlighting, does not support code prompt function

MantisBT
Mantis is an easy-to-deploy web-based defect tracking tool designed to aid in product defect tracking. It requires PHP, MySQL and a web server. Check out our demo and hosting services.

SublimeText3 Linux new version
SublimeText3 Linux latest version

PhpStorm Mac version
The latest (2018.2.1) professional PHP integrated development tool

