Microsoft Excel has many features that still amaze people. People learn something new every day. Today we'll learn how to add and customize data labels in Excel charts.
Excel charts contain large amounts of data, and it can be challenging to understand them at a glance. Using data labels is a great way to point out important information. Data labels can be used as part of a column or bar chart. It can even be used as callouts when you create a pie chart.
Add data labels
To show how to add data labels, we will use a pie chart as an example. While most people use legends to display content in pie charts, data labels are much more efficient.
To add data labels, create a pie chart. Open it and click on the tab that shows chart design. Below this, click the "Add Chart Element" drop-down menu. You will see various options - you need to hover over the data label. Once completed, you must choose a location to place the data labels. The pie chart will have various options including Center, Outside, Inside, Labeled and Best Fit. These locations may vary depending on the type of chart you are using.
You can also use other methods to add data labels. Next to the pie chart, you will see a " " symbol. This is the chart element option. You will again see data labels as one of the options. Click where you want and you're done. You can experiment with different locations when placing data labels.

Adjust data label details
After you add a data label, you can customize it based on the values you want to display. Click on the chart and click the Add Chart Element drop-down menu again. Under the Data Labels section you will see "More Data Label Options". Click on it and your data labels sidebar will open. You can mark the details to be displayed and the delimiter type.
Additionally, you can even change their appearance, such as changing the color of lines and borders, adding effects to data labels, and changing sizes and properties.
Taking your charts to the next level with data labels
Using data labels, you can make your presentations attractive and readable at a glance. As mentioned before, the possibilities with Excel are endless. Watch this space for more updates on Microsoft Office.
The above is the detailed content of How to add and customize data labels in Microsoft Excel charts?. For more information, please follow other related articles on the PHP Chinese website!
 在 Microsoft Excel 中如何创建数据透视表Apr 22, 2023 pm 12:10 PM
当您拥有大量数据时,分析数据通常会变得越来越困难。但真的必须如此吗?MicrosoftExcel提供了一个令人惊叹的内置功能,称为数据透视表,可用于轻松分析庞大的数据块。它们可用于通过创建您自己的自定义报告来有效地汇总您的数据。它们可用于自动计算列的总和,可以对其应用过滤器,可以对其中的数据进行排序等。可以对数据透视表执行的操作以及如何使用数据透视表为了缓解您的日常excel障碍是无止境的。继续阅读,了解如何轻松创建数据透视表并了解如何有效组织它。希望你喜欢阅读这篇文章。第1节:什么是数据透视
 如何阻止 Apple 在 iPhone 上收集诊断和使用数据Apr 16, 2023 pm 09:25 PM
苹果以其对用户隐私的承诺而闻名。当您购买iPhone或Mac时,您知道您正在投资一家承诺保护您的数据的公司的产品。这在我们这个时代非常重要——因为我们越来越多地将更多的个人信息存储在这些设备上。我们使用的大多数设备都会收集使用数据以改进相应的产品和服务。例如,当应用程序在您的手机上崩溃时,可以通知开发人员以帮助他们查明此错误的原因。虽然这些数据通常是匿名的,但一些用户不喜欢让公司收集他们的日志。此外,通过共享这些诊断信息,您的设备会将它们上传到公司的服务器。这可能会耗尽您的(有限)数据计划和部分
 如何用零替换 Excel 数据透视表中的空白单元格Apr 15, 2023 am 11:52 AM
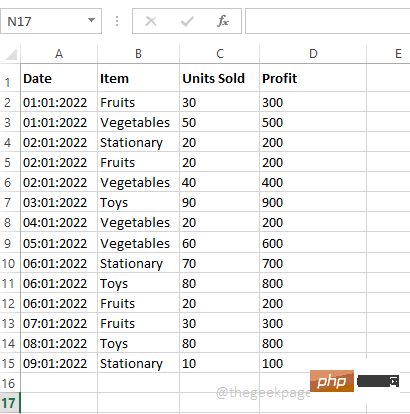
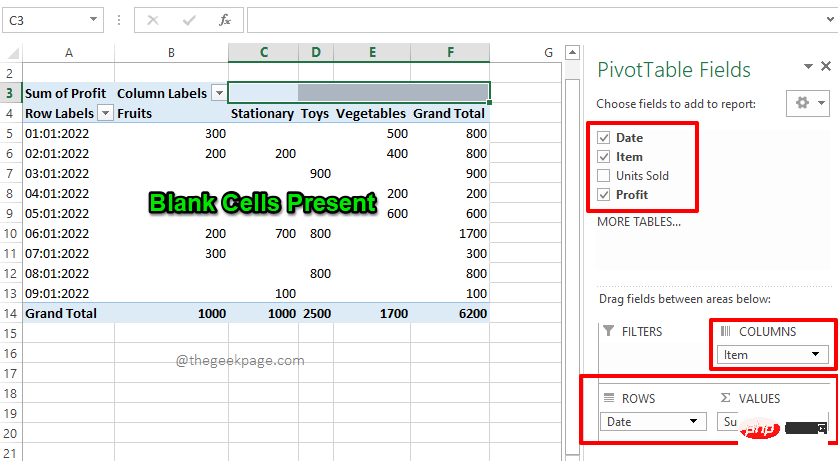
了COLUMNS部分下的字段Item、ROWS部分下的字段Date和VALUES部分下的Profit字段。注意:如果您需要有关数据透视表如何工作以及如何有效地创建数据透视表的更多信息,请参阅我们的文章如何在MicrosoftExcel中创建数据透视表。因此,根据我的选择,我的数据透视表生成如下面的屏幕截图所示,使其成为我想要的完美摘要报告。但是,如果您查看数据透视表,您会发现我的数据透视表中有一些空白单元格。现在,让我们在接下来的步骤中将它们替换为零。第6步:要用零替换空白单元格,首先右键单击数
 AI 算法在大数据治理中的应用Apr 12, 2023 pm 01:37 PM
本文主要分享 Datacake 在大数据治理中,AI 算法的应用经验。本次分享分为五大部分:第一部分阐明大数据与 AI 的关系,大数据不仅可以服务于 AI,也可以使用 AI 来优化自身服务,两者是互相支撑、依赖的关系;第二部分介绍利用 AI 模型综合评估大数据任务健康度的应用实践,为后续开展数据治理提供量化依据;第三部分介绍利用 AI 模型智能推荐 Spark 任务运行参数配置的应用实践,实现了提高云资源利用率的目标;第四部分介绍在 SQL 查询场景中,由模型智能推荐任务执行引擎的实践;第五部分
 如何在 Microsoft Excel 图表中添加和自定义数据标签?May 07, 2023 pm 04:22 PM
Microsoft Excel有许多至今令人们惊叹的功能。人们每天都会学到一些新东西。今天,我们将了解如何在Excel图表中添加和自定义数据标签。Excel图表包含大量数据,一眼看懂图表可能具有挑战性。使用数据标签是指出重要信息的好方法。数据标签可以用作柱形图或条形图的一部分。当您创建饼图时,它甚至可以用作标注。添加数据标签为了展示如何添加数据标签,我们将以饼图为例。虽然大多数人使用图例来显示饼图中的内容,但数据标签的效率要高得多。要添加数据标签,请创建饼图。打开它,然后单击显示图表设计
 腾讯广告模型基于"太极"的训练成本优化实践Apr 14, 2023 pm 06:46 PM
近年来,大数据加大模型成为了AI领域建模的标准范式。在广告场景,大模型由于使用了更多的模型参数,利用更多的训练数据,模型具备了更强的记忆能力和泛化能力,为广告效果向上提升打开了更大的空间。但是大模型在训练过程中所需要的资源也是成倍的增长,存储以及计算上的压力对机器学习平台都是巨大的挑战。腾讯太极机器学习平台持续探索降本增效方案,在广告离线训练场景利用混合部署资源大大降低了资源成本,每天为腾讯广告提供50W核心廉价混合部署资源,帮助腾讯广告离线模型训练资源成本降低30%,同时通过一系列优化手段使得
 如何使用 Go 语言进行大数据分析?Jun 11, 2023 am 11:11 AM
随着数据规模逐渐增大,大数据分析变得越来越重要。而Go语言作为一门快速、轻量级的编程语言,也成为了越来越多数据科学家和工程师的选择。本文将介绍如何使用Go语言进行大数据分析。数据采集在开始大数据分析之前,我们需要先采集数据。Go语言有很多包可以用于数据采集,例如“net/http”、“io/ioutil”等。通过这些包,我们可以从网站、API、日志

Hot AI Tools

Undresser.AI Undress
AI-powered app for creating realistic nude photos

AI Clothes Remover
Online AI tool for removing clothes from photos.

Undress AI Tool
Undress images for free

Clothoff.io
AI clothes remover

AI Hentai Generator
Generate AI Hentai for free.

Hot Article

Hot Tools

ZendStudio 13.5.1 Mac
Powerful PHP integrated development environment

SAP NetWeaver Server Adapter for Eclipse
Integrate Eclipse with SAP NetWeaver application server.

EditPlus Chinese cracked version
Small size, syntax highlighting, does not support code prompt function

DVWA
Damn Vulnerable Web App (DVWA) is a PHP/MySQL web application that is very vulnerable. Its main goals are to be an aid for security professionals to test their skills and tools in a legal environment, to help web developers better understand the process of securing web applications, and to help teachers/students teach/learn in a classroom environment Web application security. The goal of DVWA is to practice some of the most common web vulnerabilities through a simple and straightforward interface, with varying degrees of difficulty. Please note that this software

Atom editor mac version download
The most popular open source editor


