Home >Backend Development >Python Tutorial >How to draw fractal patterns using Python
How to draw fractal patterns using Python
- WBOYWBOYWBOYWBOYWBOYWBOYWBOYWBOYWBOYWBOYWBOYWBOYWBforward
- 2023-05-07 13:55:071525browse
1. Goal
Write a program that can draw an equilateral triangle, and on each side of the triangle, it must be able to draw a slightly smaller outward triangle. Being able to repeat this process as many times as one wishes creates some interesting patterns.
2. Represent the image
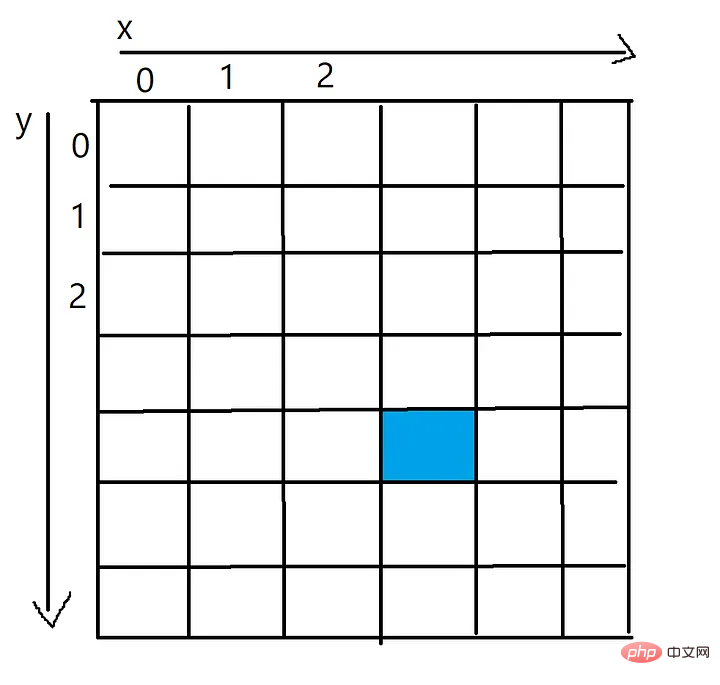
Represent the image as a two-dimensional pixel array. Each cell in the pixel array will represent the color (RGB) of that pixel.
To do this, you can use the NumPy library to generate a pixel array and use Pillow to convert it into an image that can be saved.

The x value of the blue pixel is 3 and the y value is 4, which can be accessed through a two-dimensional array, such as pixels[4][3]
3. Draw a line
Now let’s start coding. First, we need a function that can get two sets of coordinates and draw a line between them.
The code below works by interpolating between two points, adding new pixels to the pixel array at each step. You can think of this process as shading pixel by pixel on a line.
You can use the continuous character "\" in each code snippet to accommodate some longer lines of code.
import numpy as np
from PIL import Image
import math
def plot_line(from_coordinates, to_coordinates, thickness, colour, pixels):
# 找出像素阵列的边界
max_x_coordinate = len(pixels[0])
max_y_coordinate = len(pixels)
# 两点之间沿着x轴和y轴的距离
horizontal_distance = to_coordinates[1] - from_coordinates[1]
vertical_distance = to_coordinates[0] - from_coordinates[0]
# 两点之间的总距离
distance = math.sqrt((to_coordinates[1] - from_coordinates[1])**2 \
+ (to_coordinates[0] - from_coordinates[0])**2)
# 每次给一个新的像素上色时,将向前走多远
horizontal_step = horizontal_distance/distance
vertical_step = vertical_distance/distance
# 此时,将进入循环以在像素数组中绘制线
# 循环的每一次迭代都会沿着线添加一个新的点
for i in range(round(distance)):
# 这两个坐标是直线中心的坐标
current_x_coordinate = round(from_coordinates[1] + (horizontal_step*i))
current_y_coordinate = round(from_coordinates[0] + (vertical_step*i))
# 一旦得到了点的坐标,
# 就在坐标周围画出尺寸为thickness的图案
for x in range (-thickness, thickness):
for y in range (-thickness, thickness):
x_value = current_x_coordinate + x
y_value = current_y_coordinate + y
if (x_value > 0 and x_value < max_x_coordinate and \
y_value > 0 and y_value < max_y_coordinate):
pixels[y_value][x_value] = colour
# 定义图像的大小
pixels = np.zeros( (500,500,3), dtype=np.uint8 )
# 画一条线
plot_line([0,0], [499,499], 1, [255,200,0], pixels)
# 把像素阵列变成一张真正的图片
img = Image.fromarray(pixels)
# 显示得到的图片,并保存它
img.show()
img.save('Line.png')
The result of this function when drawing a yellow line between each corner of the pixel array
4. Draw a triangle
Now that we have a function that draws a line between two points, we can draw our first equilateral triangle.
Given the center point and side lengths of a triangle, the height can be calculated using the formula: h = ½(√3a).
Now using this height, center point and side lengths, the position of each corner of the triangle can be calculated. Using the plot_line function we made earlier, we can draw a line between each corner.
def draw_triangle(center, side_length, thickness, colour, pixels):
    # 等边三角形的高度是,h = ½(√3a)
    # 其中a是边长
    triangle_height = round(side_length * math.sqrt(3)/2)
    # 顶角
    top = [center[0] - triangle_height/2, center[1]]
    # 左下角
    bottom_left = [center[0] + triangle_height/2, center[1] - side_length/2]
    # 右下角
    bottom_right = [center[0] + triangle_height/2, center[1] + side_length/2]
    # 在每个角之间画一条线来完成三角形
    plot_line(top, bottom_left, thickness, colour, pixels)
    plot_line(top, bottom_right, thickness, colour, pixels)
    plot_line(bottom_left, bottom_right, thickness, colour, pixels)
The result when drawing a triangle in the center of a 500x500 pixel PNG
5. Generate fractal
Everything is ready, you can Create your first fractal in Python.
But the last step is the hardest to complete, the triangle function calls itself for each side of it, one needs to be able to calculate the center point of each new smaller triangle and rotate them correctly so that they are perpendicular to them The side to which it is attached.
You can use this function to rotate each corner of a triangle by subtracting the offset of the center point from the rotated coordinates and then applying the formula to rotate a pair of coordinates.
def rotate(coordinate, center_point, degrees):
    # 从坐标中减去旋转的点
    x = (coordinate[0] - center_point[0])
    y = (coordinate[1] - center_point[1])
    # Python的cos和sin函数采用弧度而不是度数
    radians = math.radians(degrees)
    # 计算旋转点
    new_x = (x * math.cos(radians)) - (y * math.sin(radians))
    new_y = (y * math.cos(radians)) + (x * math.sin(radians))
    # 将在开始时减去的偏移量加回旋转点上
    return [new_x + center_point[0], new_y + center_point[1]]
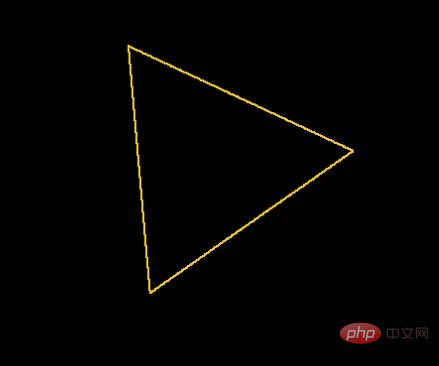
Rotate each coordinate of the triangle 35 degrees
After you can rotate a triangle, think about how to draw on each side of the first triangle A new small triangle.
To achieve this, extend the draw_triangle function to calculate the rotation and center point of a new triangle for each side, whose side lengths are reduced by the argument shrink_side_by.
Once it calculates the center point and rotation of the new triangle, it calls draw_triangle(self) to draw the new, smaller triangle from the center of the current line. This will then hit the same code block in turn, calculating another set of center points and rotations for a smaller triangle.
This is called a loop algorithm because the draw_triangle function now calls itself until it reaches the maximum depth of the triangle it wishes to draw. Having this escape sentence is important because in theory the function would loop forever (but in practice the call stack would become too large, causing a stack overflow error).
def draw_triangle(center, side_length, degrees_rotate, thickness, colour, \
                  pixels, shrink_side_by, iteration, max_depth):
    # 等边三角形的高度是,h = ½(√3a)
    # 其中'a'是边长
    triangle_height = side_length * math.sqrt(3)/2
    # 顶角
    top = [center[0] - triangle_height/2, center[1]]
    # 左下角
    bottom_left = [center[0] + triangle_height/2, center[1] - side_length/2]
    # 右下角
    bottom_right = [center[0] + triangle_height/2, center[1] + side_length/2]
    if (degrees_rotate != 0):
        top = rotate(top, center, degrees_rotate)
        bottom_left = rotate(bottom_left, center, degrees_rotate)
        bottom_right = rotate(bottom_right, center, degrees_rotate)
    # 三角形各边之间的坐标
    lines = [[top, bottom_left],[top, bottom_right],[bottom_left, bottom_right]]
    line_number = 0
    # 在每个角之间画一条线来完成三角形
    for line in lines:
        line_number += 1
        plot_line(line[0], line[1], thickness, colour, pixels)
        # 如果还没有达到max_depth,就画一些新的三角形
        if (iteration < max_depth and (iteration < 1 or line_number < 3)):
            gradient = (line[1][0] - line[0][0]) / (line[1][1] - line[0][1])
            new_side_length = side_length*shrink_side_by
            # 正在绘制的三角形线的中心
            center_of_line = [(line[0][0] + line[1][0]) / 2, \
                              (line[0][1] + line[1][1]) / 2]
            new_center = []
            new_rotation = degrees_rotate
            # 需要旋转traingle的数量
            if (line_number == 1):
                new_rotation += 60
            elif (line_number == 2):
                new_rotation -= 60
            else:
                new_rotation += 180
            # 在一个理想的世界里,这将是gradient=0,
            # 但由于浮点除法的原因,无法
            # 确保永远是这种情况
            if (gradient < 0.0001 and gradient > -0.0001):
                if (center_of_line[0] - center[0] > 0):
                    new_center = [center_of_line[0] + triangle_height * \
                                 (shrink_side_by/2), center_of_line[1]]
                else:
                    new_center = [center_of_line[0] - triangle_height * \
                                  (shrink_side_by/2), center_of_line[1]]
            else:
                # 计算直线梯度的法线
                difference_from_center = -1/gradient
                # 计算这条线距中心的距离
                # 到新三角形的中心
                distance_from_center = triangle_height * (shrink_side_by/2)
                # 计算 x 方向的长度,
                # 从线的中心到新三角形的中心
                x_length = math.sqrt((distance_from_center**2)/ \
                                     (1 + difference_from_center**2))
                # 计算出x方向需要走哪条路
                if (center_of_line[1] < center[1] and x_length > 0):
                    x_length *= -1
                # 现在计算Y方向的长度
                y_length = x_length * difference_from_center
                # 用新的x和y值来偏移线的中心
                new_center = [center_of_line[0] + y_length, \
                              center_of_line[1] + x_length]
            draw_triangle(new_center, new_side_length, new_rotation, \
                          thickness, colour, pixels, shrink_side_by, \
                          iteration+1, max_depth)
Triangular fractal, contracted sides=1/2, maximum depth=2
The above is the detailed content of How to draw fractal patterns using Python. For more information, please follow other related articles on the PHP Chinese website!

