
Home >Backend Development >Python Tutorial >Draw characters in text using Python and Matplotlib
Draw characters in text using Python and Matplotlib

- 王林forward
- 2023-04-29 19:31:051041browse
The purpose of this article is to help you get started plotting data in python. We will create a bar chart to plot the frequency of characters in a given text file. In this case, the text file contains content from The Great Gatsby.

Step 1: Create your virtual environment
The environment for this project will be smaller. Virtual environments allow you to add extra functionality to your workspace without affecting the rest of your computer!
Create a directory and open it in the code editor and terminal (where you run the command).
Let’s run:
$ python3 -m venv venv
$ source venv/bin/activate
We can install our necessary dependencies
$ pip3 install matplotlib
We will also create two files, read.txt and wordcount.py.
We will use wordcount.py to analyze the text in read.txt.
Step 2: Read the text
We can start relatively simple,
import matplotlib.pyplot as plt # plot
from collections import OrderedDict # this will be used for sorting later

file = open('read.txt')
text = file.read()
file.close()- First, it imports our drawing and sorting library
- Second, we use the built-in open function, which allows us to open a file for reading and writing
- Then we read the text inside the file and store it into a text variable
- Finally, we Close the file since we are no longer using it
That's all we need to "read" the file and store the contents in a variable.
Step 3: Analyze Characters
The best way we can keep track of characters is to use a python dictionary (called a hashmap in other programming languages).
Dictionaries are a very useful way of storing data. Just like a real dictionary, it will have a list of "words" that you can look at to see definitions.
In programming, this concept is generalized to "key/value" pairs. This means we can set up a dictionary and when I ask the dictionary for "a" it will return the total number of occurrences of "a".
So let’s code!
charDict = {} # dictionaries are defined by curly braces
def count_letter(character):
character = character.lower()
if character.isspace():
return
if character in charDict:
charDict[character] = charDict[character] + 1
else:
charDict[character] = 1

# loop through text
for i in text:
count_letter(i)

charDict = OrderedDict(sorted(charDict.items()))
Let’s review what happened here.
- First we define an empty dictionary
- Next we use the def keyword to define a function. This function takes a variable "char" and checks if it is a space (space, tab, newline). You can add other criteria for your selection, such as isalpha() to determine if the character is the letter
- and then check if it is already in the dictionary. If it's in the dictionary, it changes the value to the previous value plus 1 (since we're counting this character), otherwise it adds a new entry in the dictionary with an initial count of 1
- and then we iterate over For each character in the text variable, where "i" represents an individual character, we save and run our function to count them
- Finally, we use the OrderdedDict import to sort the dictionary alphabetically
Step 4: Draw it!
Now that our dataset is created, let’s organize it into axes and plot it!
We will create a list to represent each axis
num_list = []
char_list = []
These lists will correspond to each other , so if item 1 in char_list is "a", item 1 in num_list will be the corresponding frequency. Let's encode that as well.
char_list = [] # character
num_list = [] # frequency
# create x and y axes
for x,y in charDict.items():
char_list.append(x)
num_list.append(y)
We use two variables to loop through the key/value pairs in the dictionary we created and then add them to our data list.
Finally let's create and save this bar chart using matplotlib.
fig = plt.figure() # create a new figure
ax = fig.add_subplot() # create a new bar graph within the figure
fig.canvas.manager.set_window_title('The Great Gatsby') # title of window
ax.bar(char_list, num_list) # add the data to the graph
plt.savefig('chars.png') # download an image of the bar graph
plt.show() # show the image- First, we create a new shape. The picture shows the overall window
- Add a plot to the picture
- Add a bar chart using the data we selected
- Download the image
- Display image
Time to test it out!
Run your file using the code below and get ready for our results!
$ python3 wordcount.py
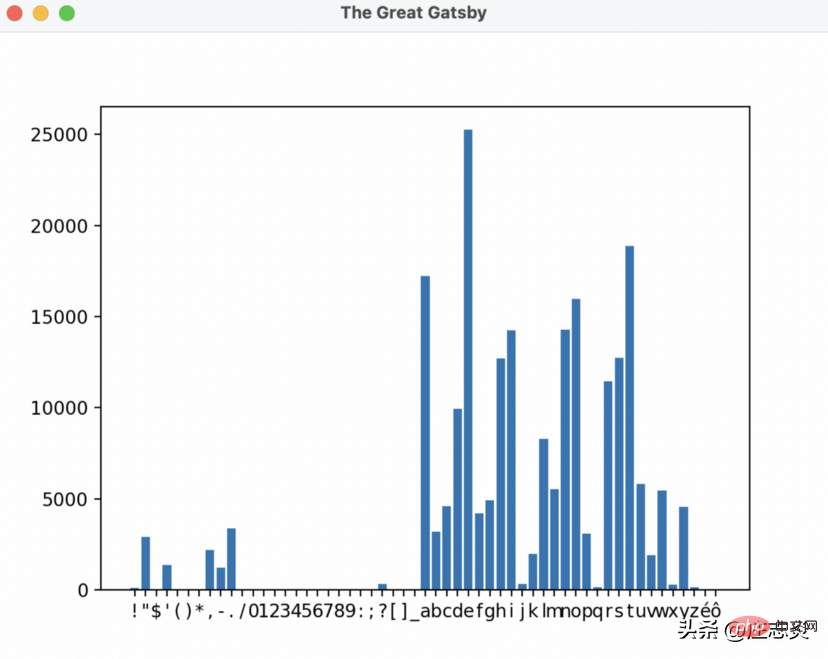
So to answer the question I asked at the beginning of the article, the letter e is used over 25,000 times in The Great Gatsby! Wow!
Conclusion
At the end of this article, I hope you learned something about matplotlib and data science.
The above is the detailed content of Draw characters in text using Python and Matplotlib. For more information, please follow other related articles on the PHP Chinese website!