Home >Backend Development >Python Tutorial >Used Python to draw several word cloud diagrams, which amazed everyone
Used Python to draw several word cloud diagrams, which amazed everyone
- 王林forward
- 2023-04-13 12:28:021780browse

In data visualization charts, the application of word cloud charts can be seen everywhere. It usually extracts word frequency from a piece of input text, and then displays high-frequency words in a concentrated manner according to the frequency of word occurrence. It is simple, intuitive and efficient. Today I will share how to draw an exquisite word cloud graph in Python.
a little test
Let’s first try to draw a simple word cloud diagram, using the wordcloud module in Python to draw it,
import jieba
from wordcloud import WordCloud
import matplotlib.pyplot as plt
We import the text content and remove the newlines and spaces. The code is as follows:
text = open(r"明朝那些事儿.txt",encoding='utf8').read()
text = text.replace('n',"").replace("u3000","")
We need to divide it into words. At this time, we need to use the jieba module. The code is as follows:
text_cut = jieba.lcut(text)
# 将分好的词用某个符号分割开连成字符串
text_cut = ' '.join(text_cut)
Of course, there may be a lot of irrelevant content that we don’t need to see in the results. At this time, we need to use stop words. We can build it ourselves, or we can directly use others. The stop word list has been constructed. The editor here uses the latter. The code is as follows:
stop_words = open(r"常见中文停用词表.txt").read().split("n")The following is the core code for drawing the word cloud chart.
word_cloud = WordCloud(font_path="simsun.ttc",# 设置词云字体
background_color="white", # 词云图的背景颜色
stopwords=stop_words) # 去掉的停词
word_cloud.generate(text_cut)
word_cloud.to_file("1.png")
output
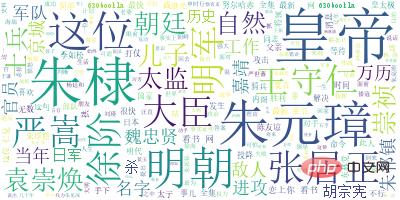
Such an extremely simple word cloud diagram is ready. Of course, we can add a background image to it, for example In the picture below,

The main code that needs to be added is as follows:
background = Image.open(r"5.png")
graph = np.array(background)
Then add the mask parameter in WorCloud
# 使用WordCloud生成词云
word_cloud = WordCloud(font_path="simsun.ttc",# 设置词云字体
background_color="white", # 词云图的背景颜色
stopwords=stop_words, # 去掉的停词
mask=graph)
word_cloud.generate(text_cut)
word_cloud.to_file("1.png")
output

Deep optimization
In addition, there is also a word cloud map drawn by another module stylecloud. Very cool, among which we mainly use the following function.
gen_stylecloud(text=None,
icon_name='fas fa-flag',
colors=None,
palette='cartocolors.qualitative.Bold_5',
background_color="white",
max_font_size=200,
max_words=2000,
stopwords=True,
custom_stopwords=STOPWORDS,
output_name='stylecloud.png',
)
Some of the commonly used parameters are
- icon_name: the shape of the word cloud graph
- max_font_size: the largest font size
- max_words: The maximum number of words that can be accommodated
- stopwords: used to filter common stop words
- custom_stopwords: If you have a self-built stop word list, You can use it
- palette: Palette
Let’s try to draw a word cloud chart. The code is as follows:
stylecloud.gen_stylecloud(text=text_cut,
 palette='tableau.BlueRed_6',
 icon_name='fas fa-apple-alt',
 font_path=r'田英章楷书3500字.ttf',
 output_name='2.png',
 stopwords=True,
 custom_stopwords=stop_words)
output

The palette parameter is used as the palette and can be changed arbitrarily. For details, please refer to: https://jiffyclub.github.io/palettable/ This website.
pyecharts
Finally, let’s take a look at how to use the Pyecharts module to draw word cloud diagrams. The code is as follows
from pyecharts import options as opts
from pyecharts.charts import Page, WordCloud
words = [
 ("皇帝", 10000),
 ("朱元璋", 6181),
 ("明朝", 4386),
 ("朝廷", 4055),
 ("明军", 2467),
 ("士兵", 2244),
 ("张居正", 1868),
 ("王守仁", 1281)
]
c = (
 WordCloud()
 .add("", words, word_size_range=[20, 100])
 .set_global_opts(title_opts=opts.TitleOpts(title="基本示例"))
 )
c.render("1.html")
output

The result is slightly simple, but it is worth noting that the data passed in by the WordCloud() method in pyecharts is the specified word and its frequency of occurrence. This Different from the previous operation
The above is the detailed content of Used Python to draw several word cloud diagrams, which amazed everyone. For more information, please follow other related articles on the PHP Chinese website!

