


Introduction to PywebIO
The PywebIO module in Python can help developers quickly build web applications or browser-based applications without HTML and JavaScript. For GUI applications, PywebIO can also be used in conjunction with some commonly used visualization modules to create a large visual screen.
Let’s first install the modules we need to use.
pip install pywebio
pip install cutecharts
The cutecharts module mentioned above is a hand-drawn style visualization artifact in Python. I believe everyone is familiar with it. Let’s take a look at the effect of combining it with the PywebIO module to draw charts. The code As follows:
from cutecharts.charts import Bar
from cutecharts.faker import Faker
from pywebio import start_server
from pywebio.output import put_html
def bar_base():
chart = Bar("Bar-基本示例", width="100%")
chart.set_options(labels=Faker.choose(), x_label="I'm xlabel", y_label="I'm ylabel")
chart.add_series("series-A", Faker.values())
put_html(chart.render_notebook())
if __name__ == '__main__':
start_server(bar_base, debug=True, port=8080)
output

The logic of the above code is not difficult to understand. First instantiate a histogram Bar() object, and then fill in the X axis The corresponding label and the corresponding Y-axis value, and finally call the put_html() method in the PywebIO module, we will see a URL.

#Enter the URL in the browser to see the chart we drew. Of course, there is a Page() method in the cutecharts module to connect various charts to create a large visual screen. The code is as follows:
def bar_base():
chart = Bar("Bar-基本示例", width="100%")
chart.set_options(labels=Faker.choose(), x_label="I'm xlabel", y_label="I'm ylabel")
chart.add_series("series-A", Faker.values())
return chart
def pie_base() -> Pie:
chart = Pie("标题", width="100%")
........
return chart
def radar_base() -> Radar:
chart = Radar("标题", width="100%")
......
return chart
def line_base() -> Line:
chart = Line("标题", width="100%")
......
return chart
def main():
page = Page()
page.add(pie_base(), pie_base(), radar_base(), line_base(), bar_base())
put_html(page.render_notebook())
if __name__ == '__main__':
start_server(main, debug=True, port=8080)
output

The combination of PywebIO and Pyecharts
When the PywebIO module meets the Pyecharts module, the logic of the code is basically the same as that of cutecharts. First, a chart object is instantiated, and then after adding the data and setting up the chart After styling, the put_html() method is finally called to render the final result in the browser.
# `chart` 是你的图表的实例
pywebio.output.put_html(chart.render_notebook())
In this case, we call the combination component in Pyecharts to present the completed charts respectively. The code is as follows:
def bar_plots():
bar = (
Bar()
.add_xaxis(Faker.choose())
.add_yaxis("商家A", Faker.values())
.add_yaxis("商家B", Faker.values())
.set_global_opts(title_opts=opts.TitleOpts(title="Grid-Bar"))
)
return bar
def line_plots():
line = (
Line()
.add_xaxis(Faker.choose())
.add_yaxis("商家A", Faker.values())
.add_yaxis("商家B", Faker.values())
.set_global_opts(
title_opts=opts.TitleOpts(title="Grid-Line", pos_top="48%"),
legend_opts=opts.LegendOpts(pos_top="48%"),
)
)
return line
def main():
c = (
Grid()
.add(bar_plots(), grid_opts=opts.GridOpts(pos_bottom="60%"))
.add(line_plots(), grid_opts=opts.GridOpts(pos_top="60%"))
)
c.width = "100%"
put_html(c.render_notebook())
if __name__ == '__main__':
start_server(main, debug=True, port=8080)
output

The combination of PywebIO and Bokeh
The combination of PywebIO and Bokeh will be slightly different from the above in terms of code syntax. The specific differences are as follows:
from bokeh.io import output_notebook
from bokeh.io import show
output_notebook(notebook_type='pywebio')
fig = figure(...)
...
show(fig)
For example, we To draw a simple histogram, the code is as follows:
def bar_plots():
output_notebook(notebook_type='pywebio')
fruits = ['Apples', 'Pears', 'Nectarines', 'Plums', 'Grapes', 'Strawberries']
counts = [5, 3, 4, 2, 4, 6]
p = figure(x_range=fruits, plot_height=350, title="Fruit Counts",
 toolbar_location=None, tools="")
p.vbar(x=fruits, top=counts, width=0.9)
p.xgrid.grid_line_color = None
p.y_range.start = 0
show(p)
if __name__ == "__main__":
start_server(bar_plots, debug=True, port=8080)
output

from pywebio.input import *
from pywebio.output import *
data = input_group(
"用户数据",
[
input("请问您的名字是: ", name="name", type=TEXT),
input("输入您的年龄", name="age", type=NUMBER),
radio(
"哪个洲的",
name="continent",
options=[
"非洲",
"亚洲",
"澳大利亚",
"欧洲",
"北美洲",
"南美洲",
],
),
checkbox(
"用户隐私条例", name="agreement", options=["同意"]
),
],
)
put_text("表格输出:")
put_table(
[
["名字", data["name"]],
["年龄", data["age"]],
["位置", data["continent"]],
["条例", data["agreement"]],
]
)
output

- input(): input of text content
- radio(): Represents the single-select box
- checkbox(): Represents the multi-select box
- input_group(): Represents the input group
- put_table(): Represents the Output group
- put_text(): represents the output text
The above is the detailed content of 50 lines of Python code to create a big data screen!. For more information, please follow other related articles on the PHP Chinese website!

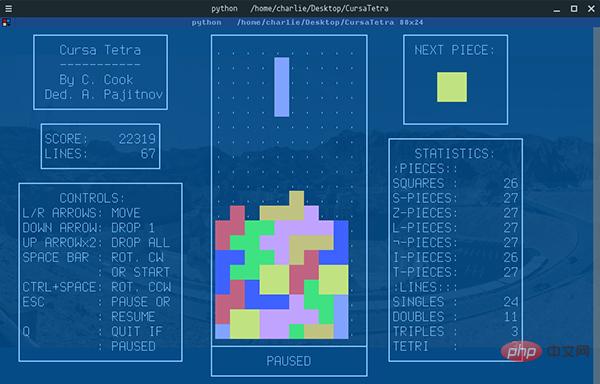 Python 文本终端 GUI 框架,太酷了Apr 12, 2023 pm 12:52 PM
Curses首先出场的是 Curses[1]。CurseCurses 是一个能提供基于文本终端窗口功能的动态库,它可以: 使用整个屏幕 创建和管理一个窗口 使用 8 种不同的彩色 为程序提供鼠标支持 使用键盘上的功能键Curses 可以在任何遵循 ANSI/POSIX 标准的 Unix/Linux 系统上运行。Windows 上也可以运行,不过需要额外安装 windows-curses 库:pip install windows-curses 上面图片,就是一哥们用 Curses 写的 俄罗斯
 五个方便好用的Python自动化脚本Apr 11, 2023 pm 07:31 PM
相比大家都听过自动化生产线、自动化办公等词汇,在没有人工干预的情况下,机器可以自己完成各项任务,这大大提升了工作效率。编程世界里有各种各样的自动化脚本,来完成不同的任务。尤其Python非常适合编写自动化脚本,因为它语法简洁易懂,而且有丰富的第三方工具库。这次我们使用Python来实现几个自动化场景,或许可以用到你的工作中。1、自动化阅读网页新闻这个脚本能够实现从网页中抓取文本,然后自动化语音朗读,当你想听新闻的时候,这是个不错的选择。代码分为两大部分,第一通过爬虫抓取网页文本呢,第二通过阅读工
 用Python写了个小工具,再复杂的文件夹,分分钟帮你整理!Apr 11, 2023 pm 08:19 PM
糟透了我承认我不是一个爱整理桌面的人,因为我觉得乱糟糟的桌面,反而容易找到文件。哈哈,可是最近桌面实在是太乱了,自己都看不下去了,几乎占满了整个屏幕。虽然一键整理桌面的软件很多,但是对于其他路径下的文件,我同样需要整理,于是我想到使用Python,完成这个需求。效果展示我一共为将文件分为9个大类,分别是图片、视频、音频、文档、压缩文件、常用格式、程序脚本、可执行程序和字体文件。# 不同文件组成的嵌套字典 file_dict = { '图片': ['jpg','png','gif','webp
 用 WebAssembly 在浏览器中运行 PythonApr 11, 2023 pm 09:43 PM
长期以来,Python 社区一直在讨论如何使 Python 成为网页浏览器中流行的编程语言。然而网络浏览器实际上只支持一种编程语言:JavaScript。随着网络技术的发展,我们已经把越来越多的程序应用在网络上,如游戏、数据科学可视化以及音频和视频编辑软件。这意味着我们已经把繁重的计算带到了网络上——这并不是JavaScript的设计初衷。所有这些挑战提出了对新编程语言的需求,这种语言可以提供快速、可移植、紧凑和安全的代码执行。因此,主要的浏览器供应商致力于实现这个想法,并在2017年向世界推出
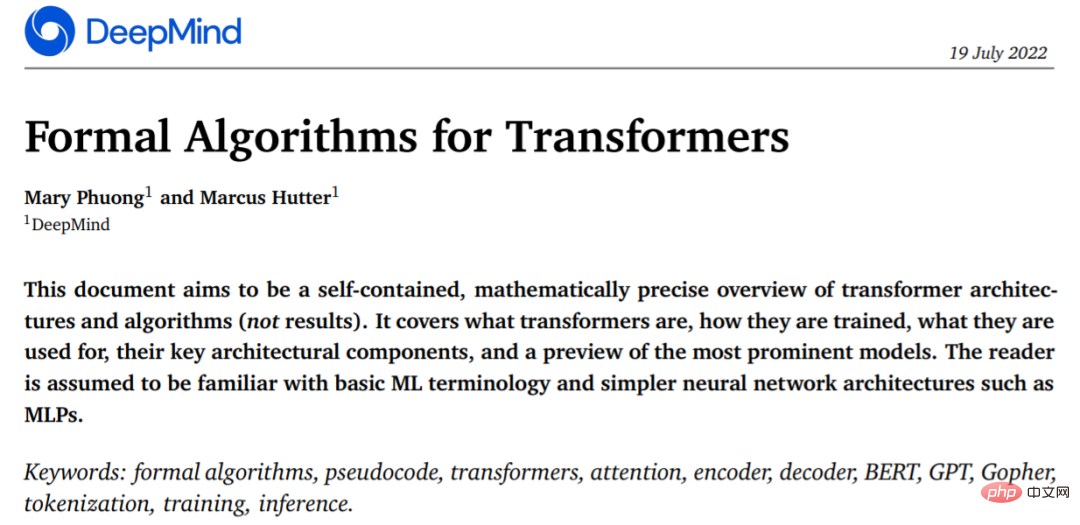 从头开始构建,DeepMind新论文用伪代码详解TransformerApr 09, 2023 pm 08:31 PM
2017 年 Transformer 横空出世,由谷歌在论文《Attention is all you need》中引入。这篇论文抛弃了以往深度学习任务里面使用到的 CNN 和 RNN。这一开创性的研究颠覆了以往序列建模和 RNN 划等号的思路,如今被广泛用于 NLP。大热的 GPT、BERT 等都是基于 Transformer 构建的。Transformer 自推出以来,研究者已经提出了许多变体。但大家对 Transformer 的描述似乎都是以口头形式、图形解释等方式介绍该架构。关于 Tra
 一文读懂层次聚类(Python代码)Apr 11, 2023 pm 09:13 PM
首先要说,聚类属于机器学习的无监督学习,而且也分很多种方法,比如大家熟知的有K-means。层次聚类也是聚类中的一种,也很常用。下面我先简单回顾一下K-means的基本原理,然后慢慢引出层次聚类的定义和分层步骤,这样更有助于大家理解。层次聚类和K-means有什么不同?K-means 工作原理可以简要概述为: 决定簇数(k) 从数据中随机选取 k 个点作为质心 将所有点分配到最近的聚类质心 计算新形成的簇的质心 重复步骤 3 和 4这是一个迭代过程,直到新形成的簇的质心不变,或者达到最大迭代次数
 用 Python 实现导弹自动追踪,超燃!Apr 12, 2023 am 08:04 AM
大家好,我是J哥。这个没有点数学基础是很难算出来的。但是我们有了计算机就不一样了,依靠计算机极快速的运算速度,我们利用微分的思想,加上一点简单的三角学知识,就可以实现它。好,话不多说,我们来看看它的算法原理,看图:由于待会要用pygame演示,它的坐标系是y轴向下,所以这里我们也用y向下的坐标系。算法总的思想就是根据上图,把时间t分割成足够小的片段(比如1/1000,这个时间片越小越精确),每一个片段分别构造如上三角形,计算出导弹下一个时间片走的方向(即∠a)和走的路程(即vt=|AC|),这时
 Python-master,实用Python脚本合集!Apr 11, 2023 pm 05:04 PM
Python这门语言很适合用来写些实用的小脚本,跑个自动化、爬虫、算法什么的,非常方便。这也是很多人学习Python的乐趣所在,可能只需要花个礼拜入门语法,就能用第三方库去解决实际问题。我在Github上就看到过不少Python代码的项目,几十行代码就能实现一个场景功能,非常实用。比方说仓库Python-master里就有很多不错的实用Python脚本,举几个简单例子:1. 创建二维码import pyqrcode import png from pyqrcode import QRCode


Hot AI Tools

Undresser.AI Undress
AI-powered app for creating realistic nude photos

AI Clothes Remover
Online AI tool for removing clothes from photos.

Undress AI Tool
Undress images for free

Clothoff.io
AI clothes remover

AI Hentai Generator
Generate AI Hentai for free.

Hot Article
Hot Tools

VSCode Windows 64-bit Download
A free and powerful IDE editor launched by Microsoft

PhpStorm Mac version
The latest (2018.2.1) professional PHP integrated development tool

DVWA
Damn Vulnerable Web App (DVWA) is a PHP/MySQL web application that is very vulnerable. Its main goals are to be an aid for security professionals to test their skills and tools in a legal environment, to help web developers better understand the process of securing web applications, and to help teachers/students teach/learn in a classroom environment Web application security. The goal of DVWA is to practice some of the most common web vulnerabilities through a simple and straightforward interface, with varying degrees of difficulty. Please note that this software

Zend Studio 13.0.1
Powerful PHP integrated development environment

EditPlus Chinese cracked version
Small size, syntax highlighting, does not support code prompt function

