
Home >Backend Development >Python Tutorial >Complete Python operational examples for ten clustering algorithms
Complete Python operational examples for ten clustering algorithms

- 王林forward
- 2023-04-13 09:40:101360browse

Clustering or cluster analysis is an unsupervised learning problem. It is often used as a data analysis technique to discover interesting patterns in data, such as customer segments based on their behavior. There are many clustering algorithms to choose from, and there is no single best clustering algorithm for all situations. Instead, it is better to explore a range of clustering algorithms and different configurations of each algorithm. In this tutorial, you will discover how to install and use top clustering algorithms in python.
After completing this tutorial, you will know:
- Clustering is the unsupervised problem of finding natural groups in the feature space of the input data.
- There are many different clustering algorithms and a single best method for all data sets.
- How to implement, adapt, and use top-level clustering algorithms in Python with the scikit-learn machine learning library.
Tutorial Overview
- This tutorial is divided into three parts:
- Clustering
- Clustering algorithm
- Clustering algorithm example
- Library installation
- Clustering data set
- Affinity propagation
- Aggregation clustering Class
- BIRCH
- DBSCAN
- K-Mean
- Mini-Batch K-Mean
- Mean Shift
- OPTICS
- Spectral clustering
- Gaussian mixture model
1. Clustering
Clustering analysis, that is, clustering, is an independent Supervised machine learning tasks. It includes automatic discovery of natural groupings in data. Unlike supervised learning (similar to predictive modeling), clustering algorithms simply interpret the input data and find natural groups or clusters in the feature space.
- Clustering techniques are suitable when there are no classes to predict, but instances are divided into natural groups.
- —From: "Data Mining Page: Practical Machine Learning Tools and Techniques" 2016.
Clusters are typically dense regions in feature space where examples (observations or data rows) from a domain are closer to the cluster than other clusters. A cluster can have a center (centroid) that is a sample or point feature space, and can have boundaries or ranges.
- These clusters may reflect some mechanism at work in the domain from which the instances are drawn, which makes some instances more similar to each other than they are to the rest of the instances.
- —From: "Data Mining Page: Practical Machine Learning Tools and Techniques" 2016.
Clustering can help as a data analysis activity in order to learn more about the problem domain, known as pattern discovery or knowledge discovery. For example:
- The evolutionary tree can be considered as the result of artificial cluster analysis;
- Separating normal data from outliers or anomalies may be considered as a clustering problem;
- Separating clusters based on natural behavior is a clustering problem called market segmentation.
Clustering can also be used as a type of feature engineering, where existing and new examples can be mapped and labeled as belonging to one of the clusters identified in the data. While many cluster-specific quantitative measures do exist, assessment of identified clusters is subjective and may require domain experts. Typically, clustering algorithms are academically compared on synthetic datasets with predefined clusters that the algorithm is expected to discover.
- Clustering is an unsupervised learning technique, so it is difficult to evaluate the quality of the output of any given method.
- —From: "Machine Learning Page: A Probabilistic Perspective" 2012.
2. Clustering algorithm
There are many types of clustering algorithms. Many algorithms use similarity or distance measures between examples in feature space to discover dense observation regions. Therefore, it is often good practice to expand your data before using a clustering algorithm.
- At the heart of all goals of cluster analysis is the concept of the degree of similarity (or dissimilarity) between the individual objects being clustered. Clustering methods attempt to group objects based on a similarity definition provided to the objects.
- —From: "Elements of Statistical Learning: Data Mining, Inference, and Prediction," 2016
Some clustering algorithms require you to specify or guess the clusters you want to discover in the data number, while other algorithms require a specified minimum distance between observations where examples can be considered "closed" or "connected". Cluster analysis is therefore an iterative process in which subjective assessments of identified clusters are fed back into changes in algorithm configuration until desired or appropriate results are achieved. The scikit-learn library provides a set of different clustering algorithms to choose from. Listed below are 10 of the more popular algorithms:
- Affinity Propagation
- Aggregate Clustering
- BIRCH
- DBSCAN
- K-Means
- Mini-Batch K -Mean
- Mean Shift
- OPTICS
- Spectral Clustering
- Gaussian Mixture
Each algorithm provides a A different approach to the challenge of discovering natural groups in data. There is no best clustering algorithm, and there is no easy way to find the best algorithm for your data without using controlled experiments. In this tutorial, we will review how to use each of these 10 popular clustering algorithms from the scikit-learn library. These examples will provide you with a basis for copying and pasting the examples and testing the methods on your own data. We won't delve into the theory of how algorithms work, nor will we directly compare them. Let’s dig a little deeper.
3. Clustering Algorithm Examples
In this section, we will review how to use 10 popular clustering algorithms in scikit-learn. This includes an example of fitting a model and an example of visualizing the results. These examples are for pasting and copying into your own project and applying the methods to your own data.
1. Library installation
First, let’s install the library. Don't skip this step as you need to make sure you have the latest version installed. You can install the scikit-learn repository using the pip Python installer as shown below:
sudo pip install scikit-learn
Next, let’s confirm that the library has been installed and that you are using a modern version. Run the following script to output the library version number.
# 检查 scikit-learn 版本
import sklearn
print(sklearn.__version__)
When you run the example, you should see the following version number or higher.
0.22.1
2. Clustering data set
We will use the make _ classification () function to create a test binary classification data set. The dataset will have 1000 examples, with two input features and one cluster per class. These clusters are visible in two dimensions, so we can plot the data in a scatter plot and color the points in the plot by the specified cluster.
This will help to understand, at least on the test problem, how well the clusters are identified. The clusters in this test problem are based on multivariate Gaussians, and not all clustering algorithms are effective at identifying these types of clusters. Therefore, the results in this tutorial should not be used as a basis for comparing general methods. Listed below are examples of creating and summarizing synthetic clustering datasets.
# 综合分类数据集
from numpy import where
from sklearn.datasets import make_classification
from matplotlib import pyplot
# 定义数据集
X, y = make_classification(n_samples=1000, n_features=2, n_informative=2, n_redundant=0, n_clusters_per_class=1, random_state=4)
# 为每个类的样本创建散点图
for class_value in range(2):
# 获取此类的示例的行索引
row_ix = where(y == class_value)
# 创建这些样本的散布
pyplot.scatter(X[row_ix, 0], X[row_ix, 1])
# 绘制散点图
pyplot.show()
Running this example will create a synthetic clustered dataset and then create a scatterplot of the input data, with points colored by class labels (idealized clusters). We can clearly see two different data groups in two dimensions and hope that an automatic clustering algorithm can detect these groupings.
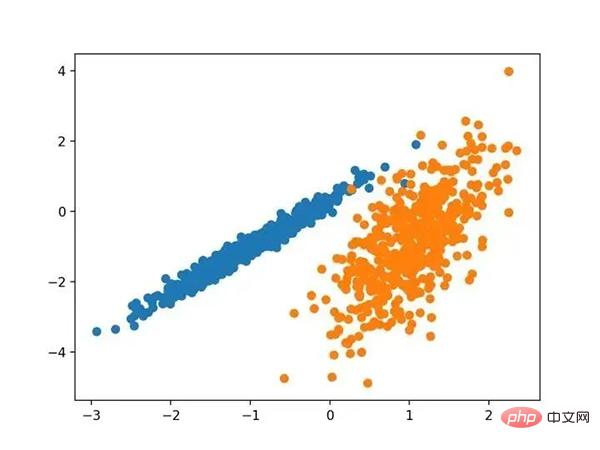
Scatterplot of a synthetic clustered dataset of known clustered colored points
Next, we can start looking at the results applied to this dataset Example of clustering algorithm. I've made some minimal attempts to adapt each method to the dataset.
3. Affinity propagation
Affinity propagation involves finding a set of exemplars that best summarizes the data.
- We designed a method called "affinity propagation" that serves as an input measure of similarity between two pairs of data points. Real-valued messages are exchanged between data points until a set of high-quality examples and corresponding clusters gradually emerge
- —From: "By passing messages between data points" 2007.
It is implemented through the AffinityPropagation class, the main configuration to adjust is to set the "Dampening" from 0.5 to 1, maybe even the "Preferences".
Full examples are listed below.
# 亲和力传播聚类
from numpy import unique
from numpy import where
from sklearn.datasets import make_classification
from sklearn.cluster import AffinityPropagation
from matplotlib import pyplot
# 定义数据集
X, _ = make_classification(n_samples=1000, n_features=2, n_informative=2, n_redundant=0, n_clusters_per_class=1, random_state=4)
# 定义模型
model = AffinityPropagation(damping=0.9)
# 匹配模型
model.fit(X)
# 为每个示例分配一个集群
yhat = model.predict(X)
# 检索唯一群集
clusters = unique(yhat)
# 为每个群集的样本创建散点图
for cluster in clusters:
# 获取此群集的示例的行索引
row_ix = where(yhat == cluster)
# 创建这些样本的散布
pyplot.scatter(X[row_ix, 0], X[row_ix, 1])
# 绘制散点图
pyplot.show()
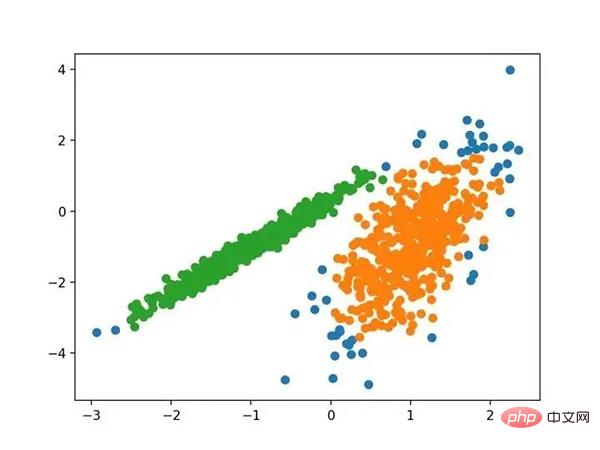
Run the example to fit the model on the training dataset and predict the clusters for each example in the dataset. A scatter plot is then created, colored by its assigned clusters. In this case I am not able to achieve good results.
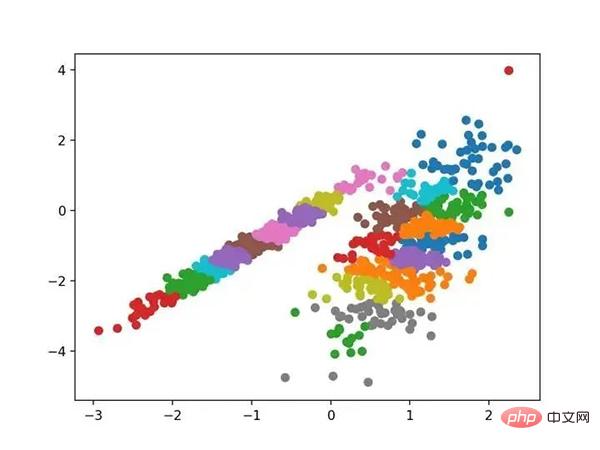
Scatterplot of the dataset with clusters identified using affinity propagation
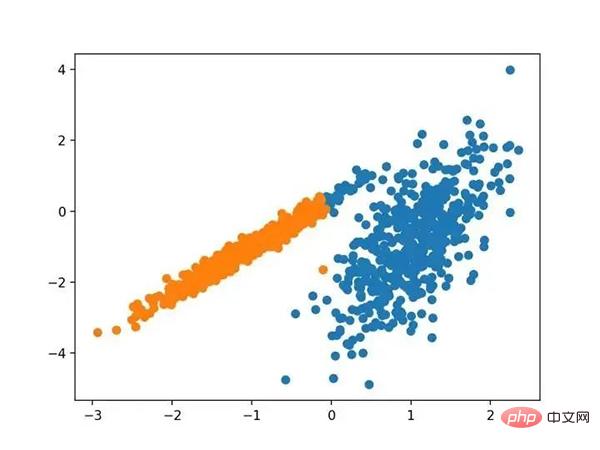
4. Aggregate Clustering
Aggregate Clustering Involves merging examples until the desired number of clusters is reached. It is part of a broader class of hierarchical clustering methods, implemented through the AgglomerationClustering class, and the main configuration is the " n_clusters " set, which is an estimate of the number of clusters in the data, e.g. 2. A complete example is listed below.
# 聚合聚类
from numpy import unique
from numpy import where
from sklearn.datasets import make_classification
from sklearn.cluster import AgglomerativeClustering
from matplotlib import pyplot
# 定义数据集
X, _ = make_classification(n_samples=1000, n_features=2, n_informative=2, n_redundant=0, n_clusters_per_class=1, random_state=4)
# 定义模型
model = AgglomerativeClustering(n_clusters=2)
# 模型拟合与聚类预测
yhat = model.fit_predict(X)
# 检索唯一群集
clusters = unique(yhat)
# 为每个群集的样本创建散点图
for cluster in clusters:
# 获取此群集的示例的行索引
row_ix = where(yhat == cluster)
# 创建这些样本的散布
pyplot.scatter(X[row_ix, 0], X[row_ix, 1])
# 绘制散点图
pyplot.show()
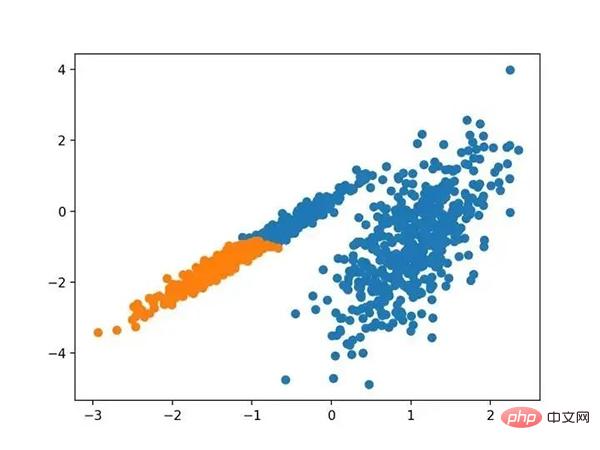
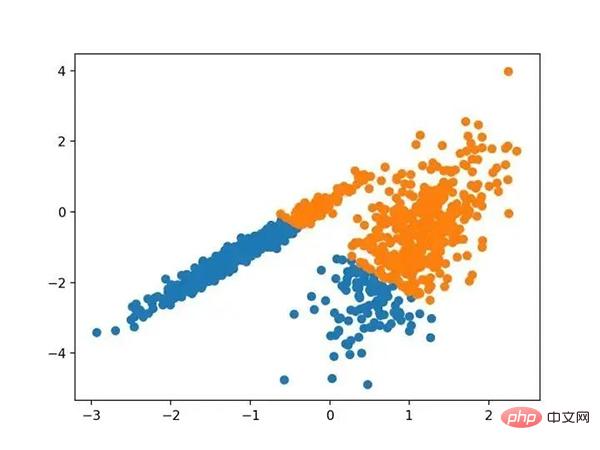
Run the example to fit the model on the training dataset and predict the clusters for each example in the dataset. A scatter plot is then created, colored by its assigned clusters. In this case, a reasonable grouping can be found.

Scatterplot of a data set with clusters identified using agglomerative clustering
5.BIRCH
BIRCH 聚类( BIRCH 是平衡迭代减少的缩写,聚类使用层次结构)包括构造一个树状结构,从中提取聚类质心。
- BIRCH 递增地和动态地群集传入的多维度量数据点,以尝试利用可用资源(即可用内存和时间约束)产生最佳质量的聚类。
- —源自:《 BIRCH :1996年大型数据库的高效数据聚类方法》
它是通过 Birch 类实现的,主要配置是“ threshold ”和“ n _ clusters ”超参数,后者提供了群集数量的估计。下面列出了完整的示例。
# birch聚类
from numpy import unique
from numpy import where
from sklearn.datasets import make_classification
from sklearn.cluster import Birch
from matplotlib import pyplot
# 定义数据集
X, _ = make_classification(n_samples=1000, n_features=2, n_informative=2, n_redundant=0, n_clusters_per_class=1, random_state=4)
# 定义模型
model = Birch(threshold=0.01, n_clusters=2)
# 适配模型
model.fit(X)
# 为每个示例分配一个集群
yhat = model.predict(X)
# 检索唯一群集
clusters = unique(yhat)
# 为每个群集的样本创建散点图
for cluster in clusters:
# 获取此群集的示例的行索引
row_ix = where(yhat == cluster)
# 创建这些样本的散布
pyplot.scatter(X[row_ix, 0], X[row_ix, 1])
# 绘制散点图
pyplot.show()
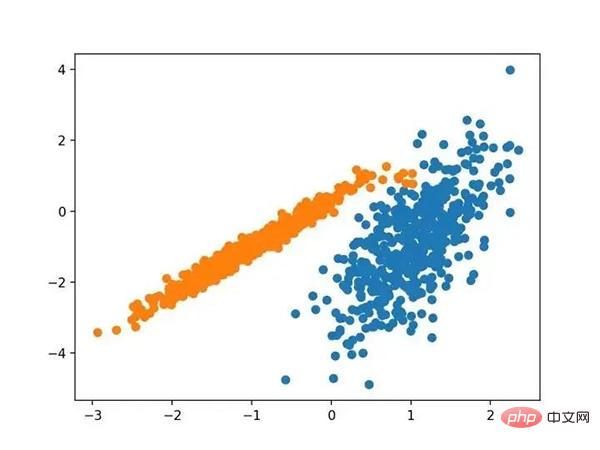
运行该示例符合训练数据集上的模型,并预测数据集中每个示例的群集。然后创建一个散点图,并由其指定的群集着色。在这种情况下,可以找到一个很好的分组。
使用BIRCH聚类确定具有聚类的数据集的散点图
6.DBSCAN
DBSCAN 聚类(其中 DBSCAN 是基于密度的空间聚类的噪声应用程序)涉及在域中寻找高密度区域,并将其周围的特征空间区域扩展为群集。
- …我们提出了新的聚类算法 DBSCAN 依赖于基于密度的概念的集群设计,以发现任意形状的集群。DBSCAN 只需要一个输入参数,并支持用户为其确定适当的值
- -源自:《基于密度的噪声大空间数据库聚类发现算法》,1996
它是通过 DBSCAN 类实现的,主要配置是“ eps ”和“ min _ samples ”超参数。
下面列出了完整的示例。
# dbscan 聚类
from numpy import unique
from numpy import where
from sklearn.datasets import make_classification
from sklearn.cluster import DBSCAN
from matplotlib import pyplot
# 定义数据集
X, _ = make_classification(n_samples=1000, n_features=2, n_informative=2, n_redundant=0, n_clusters_per_class=1, random_state=4)
# 定义模型
model = DBSCAN(eps=0.30, min_samples=9)
# 模型拟合与聚类预测
yhat = model.fit_predict(X)
# 检索唯一群集
clusters = unique(yhat)
# 为每个群集的样本创建散点图
for cluster in clusters:
# 获取此群集的示例的行索引
row_ix = where(yhat == cluster)
# 创建这些样本的散布
pyplot.scatter(X[row_ix, 0], X[row_ix, 1])
# 绘制散点图
pyplot.show()
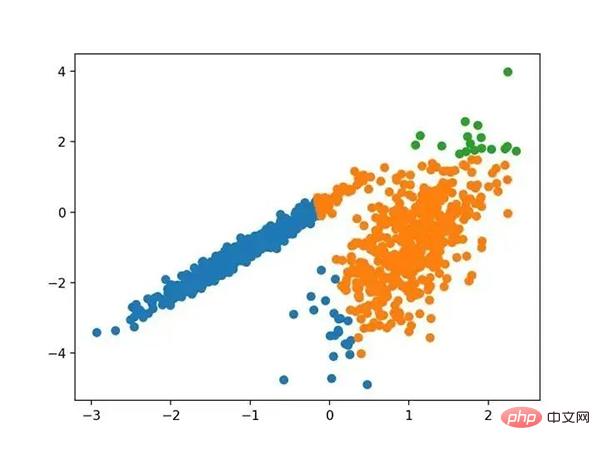
运行该示例符合训练数据集上的模型,并预测数据集中每个示例的群集。然后创建一个散点图,并由其指定的群集着色。在这种情况下,尽管需要更多的调整,但是找到了合理的分组。
使用DBSCAN集群识别出具有集群的数据集的散点图
7.K均值
K-均值聚类可以是最常见的聚类算法,并涉及向群集分配示例,以尽量减少每个群集内的方差。
- 本文的主要目的是描述一种基于样本将 N 维种群划分为 k 个集合的过程。这个叫做“ K-均值”的过程似乎给出了在类内方差意义上相当有效的分区。
- -源自:《关于多元观测的分类和分析的一些方法》1967年
它是通过 K-均值类实现的,要优化的主要配置是“ n _ clusters ”超参数设置为数据中估计的群集数量。下面列出了完整的示例。
# k-means 聚类
from numpy import unique
from numpy import where
from sklearn.datasets import make_classification
from sklearn.cluster import KMeans
from matplotlib import pyplot
# 定义数据集
X, _ = make_classification(n_samples=1000, n_features=2, n_informative=2, n_redundant=0, n_clusters_per_class=1, random_state=4)
# 定义模型
model = KMeans(n_clusters=2)
# 模型拟合
model.fit(X)
# 为每个示例分配一个集群
yhat = model.predict(X)
# 检索唯一群集
clusters = unique(yhat)
# 为每个群集的样本创建散点图
for cluster in clusters:
# 获取此群集的示例的行索引
row_ix = where(yhat == cluster)
# 创建这些样本的散布
pyplot.scatter(X[row_ix, 0], X[row_ix, 1])
# 绘制散点图
pyplot.show()
运行该示例符合训练数据集上的模型,并预测数据集中每个示例的群集。然后创建一个散点图,并由其指定的群集着色。在这种情况下,可以找到一个合理的分组,尽管每个维度中的不等等方差使得该方法不太适合该数据集。
使用K均值聚类识别出具有聚类的数据集的散点图
8.Mini-Batch K-均值
Mini-Batch K-均值是 K-均值的修改版本,它使用小批量的样本而不是整个数据集对群集质心进行更新,这可以使大数据集的更新速度更快,并且可能对统计噪声更健壮。
- ...我们建议使用 k-均值聚类的迷你批量优化。与经典批处理算法相比,这降低了计算成本的数量级,同时提供了比在线随机梯度下降更好的解决方案。
- —源自:《Web-Scale K-均值聚类》2010
它是通过 MiniBatchKMeans 类实现的,要优化的主配置是“ n _ clusters ”超参数,设置为数据中估计的群集数量。下面列出了完整的示例。
# mini-batch k均值聚类
from numpy import unique
from numpy import where
from sklearn.datasets import make_classification
from sklearn.cluster import MiniBatchKMeans
from matplotlib import pyplot
# 定义数据集
X, _ = make_classification(n_samples=1000, n_features=2, n_informative=2, n_redundant=0, n_clusters_per_class=1, random_state=4)
# 定义模型
model = MiniBatchKMeans(n_clusters=2)
# 模型拟合
model.fit(X)
# 为每个示例分配一个集群
yhat = model.predict(X)
# 检索唯一群集
clusters = unique(yhat)
# 为每个群集的样本创建散点图
for cluster in clusters:
# 获取此群集的示例的行索引
row_ix = where(yhat == cluster)
# 创建这些样本的散布
pyplot.scatter(X[row_ix, 0], X[row_ix, 1])
# 绘制散点图
pyplot.show()
运行该示例符合训练数据集上的模型,并预测数据集中每个示例的群集。然后创建一个散点图,并由其指定的群集着色。在这种情况下,会找到与标准 K-均值算法相当的结果。
带有最小批次K均值聚类的聚类数据集的散点图
9.均值漂移聚类
均值漂移聚类涉及到根据特征空间中的实例密度来寻找和调整质心。
- 对离散数据证明了递推平均移位程序收敛到最接近驻点的基础密度函数,从而证明了它在检测密度模式中的应用。
- —源自:《Mean Shift :面向特征空间分析的稳健方法》,2002
它是通过 MeanShift 类实现的,主要配置是“带宽”超参数。下面列出了完整的示例。
# 均值漂移聚类
from numpy import unique
from numpy import where
from sklearn.datasets import make_classification
from sklearn.cluster import MeanShift
from matplotlib import pyplot
# 定义数据集
X, _ = make_classification(n_samples=1000, n_features=2, n_informative=2, n_redundant=0, n_clusters_per_class=1, random_state=4)
# 定义模型
model = MeanShift()
# 模型拟合与聚类预测
yhat = model.fit_predict(X)
# 检索唯一群集
clusters = unique(yhat)
# 为每个群集的样本创建散点图
for cluster in clusters:
# 获取此群集的示例的行索引
row_ix = where(yhat == cluster)
# 创建这些样本的散布
pyplot.scatter(X[row_ix, 0], X[row_ix, 1])
# 绘制散点图
pyplot.show()
运行该示例符合训练数据集上的模型,并预测数据集中每个示例的群集。然后创建一个散点图,并由其指定的群集着色。在这种情况下,可以在数据中找到一组合理的群集。
具有均值漂移聚类的聚类数据集散点图
10.OPTICS
OPTICS 聚类( OPTICS 短于订购点数以标识聚类结构)是上述 DBSCAN 的修改版本。
- 我们为聚类分析引入了一种新的算法,它不会显式地生成一个数据集的聚类;而是创建表示其基于密度的聚类结构的数据库的增强排序。此群集排序包含相当于密度聚类的信息,该信息对应于范围广泛的参数设置。
- —源自:《OPTICS :排序点以标识聚类结构》,1999
它是通过 OPTICS 类实现的,主要配置是“ eps ”和“ min _ samples ”超参数。下面列出了完整的示例。
# optics聚类
from numpy import unique
from numpy import where
from sklearn.datasets import make_classification
from sklearn.cluster import OPTICS
from matplotlib import pyplot
# 定义数据集
X, _ = make_classification(n_samples=1000, n_features=2, n_informative=2, n_redundant=0, n_clusters_per_class=1, random_state=4)
# 定义模型
model = OPTICS(eps=0.8, min_samples=10)
# 模型拟合与聚类预测
yhat = model.fit_predict(X)
# 检索唯一群集
clusters = unique(yhat)
# 为每个群集的样本创建散点图
for cluster in clusters:
# 获取此群集的示例的行索引
row_ix = where(yhat == cluster)
# 创建这些样本的散布
pyplot.scatter(X[row_ix, 0], X[row_ix, 1])
# 绘制散点图
pyplot.show()
运行该示例符合训练数据集上的模型,并预测数据集中每个示例的群集。然后创建一个散点图,并由其指定的群集着色。在这种情况下,我无法在此数据集上获得合理的结果。
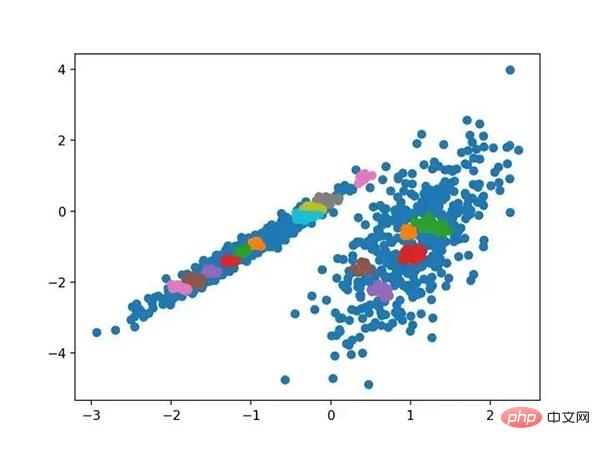
使用OPTICS聚类确定具有聚类的数据集的散点图
11.光谱聚类
光谱聚类是一类通用的聚类方法,取自线性线性代数。
- 最近在许多领域出现的一个有希望的替代方案是使用聚类的光谱方法。这里,使用从点之间的距离导出的矩阵的顶部特征向量。
- —源自:《关于光谱聚类:分析和算法》,2002年
它是通过 Spectral 聚类类实现的,而主要的 Spectral 聚类是一个由聚类方法组成的通用类,取自线性线性代数。要优化的是“ n _ clusters ”超参数,用于指定数据中的估计群集数量。下面列出了完整的示例。
# spectral clustering
from numpy import unique
from numpy import where
from sklearn.datasets import make_classification
from sklearn.cluster import SpectralClustering
from matplotlib import pyplot
# 定义数据集
X, _ = make_classification(n_samples=1000, n_features=2, n_informative=2, n_redundant=0, n_clusters_per_class=1, random_state=4)
# 定义模型
model = SpectralClustering(n_clusters=2)
# 模型拟合与聚类预测
yhat = model.fit_predict(X)
# 检索唯一群集
clusters = unique(yhat)
# 为每个群集的样本创建散点图
for cluster in clusters:
# 获取此群集的示例的行索引
row_ix = where(yhat == cluster)
# 创建这些样本的散布
pyplot.scatter(X[row_ix, 0], X[row_ix, 1])
# 绘制散点图
pyplot.show()
运行该示例符合训练数据集上的模型,并预测数据集中每个示例的群集。然后创建一个散点图,并由其指定的群集着色。
在这种情况下,找到了合理的集群。
使用光谱聚类聚类识别出具有聚类的数据集的散点图
12.高斯混合模型
高斯混合模型总结了一个多变量概率密度函数,顾名思义就是混合了高斯概率分布。它是通过 Gaussian Mixture 类实现的,要优化的主要配置是“ n _ clusters ”超参数,用于指定数据中估计的群集数量。下面列出了完整的示例。
# 高斯混合模型
from numpy import unique
from numpy import where
from sklearn.datasets import make_classification
from sklearn.mixture import GaussianMixture
from matplotlib import pyplot
# 定义数据集
X, _ = make_classification(n_samples=1000, n_features=2, n_informative=2, n_redundant=0, n_clusters_per_class=1, random_state=4)
# 定义模型
model = GaussianMixture(n_components=2)
# 模型拟合
model.fit(X)
# 为每个示例分配一个集群
yhat = model.predict(X)
# 检索唯一群集
clusters = unique(yhat)
# 为每个群集的样本创建散点图
for cluster in clusters:
# 获取此群集的示例的行索引
row_ix = where(yhat == cluster)
# 创建这些样本的散布
pyplot.scatter(X[row_ix, 0], X[row_ix, 1])
# 绘制散点图
pyplot.show()
运行该示例符合训练数据集上的模型,并预测数据集中每个示例的群集。然后创建一个散点图,并由其指定的群集着色。在这种情况下,我们可以看到群集被完美地识别。这并不奇怪,因为数据集是作为 Gaussian 的混合生成的。

使用高斯混合聚类识别出具有聚类的数据集的散点图
三.总结
在本教程中,您发现了如何在 python 中安装和使用顶级聚类算法。具体来说,你学到了:
- 聚类是在特征空间输入数据中发现自然组的无监督问题。
- 有许多不同的聚类算法,对于所有数据集没有单一的最佳方法。
- 在 scikit-learn 机器学习库的 Python 中如何实现、适合和使用顶级聚类算法。
The above is the detailed content of Complete Python operational examples for ten clustering algorithms. For more information, please follow other related articles on the PHP Chinese website!