Home >Backend Development >Python Tutorial >Artifact to easily visualize the Python program calling process
Artifact to easily visualize the Python program calling process
- 王林forward
- 2023-04-12 22:10:041836browse

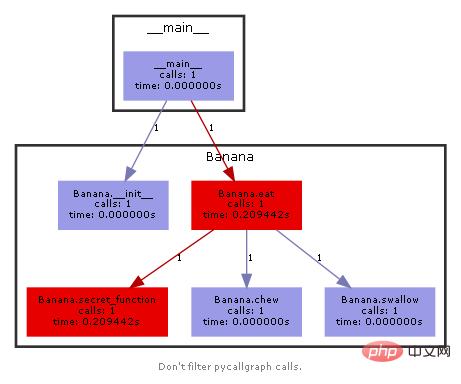
Let’s take a look at the renderings first:

How about it, it’s very amazing~
Below Let's complete this visualization process together.
1. Install the graphviz tool
The process of generating images depends on the tool graphviz. We download and install it first.
Download address
- http://www.graphviz.org/download/
2. Actual combat
Next we Two Python dependent libraries also need to be installed.
pip install pycallgraph
Let’s write a basic code first;
from pycallgraph import PyCallGraph
from pycallgraph.output import GraphvizOutput
class Banana:
 def eat(self):
 pass
class Person:
 def __init__(self):
 self.no_bananas()
 def no_bananas(self):
 self.bananas = []
 def add_banana(self, banana):
 self.bananas.append(banana)
 def eat_bananas(self):
 [banana.eat() for banana in self.bananas]
 self.no_bananas()
def main():
 graphviz = GraphvizOutput()
 graphviz.output_file = 'basic.png'
 with PyCallGraph(output=graphviz):
 person = Person()
 for a in range(10):
 person.add_banana(Banana())
 person.eat_bananas()
if __name__ == '__main__':
 main()
The code is relatively simple and defines two simple classes. The core code of pycallgraph is mainly in the main function, under the with code block. Execute the code we defined once
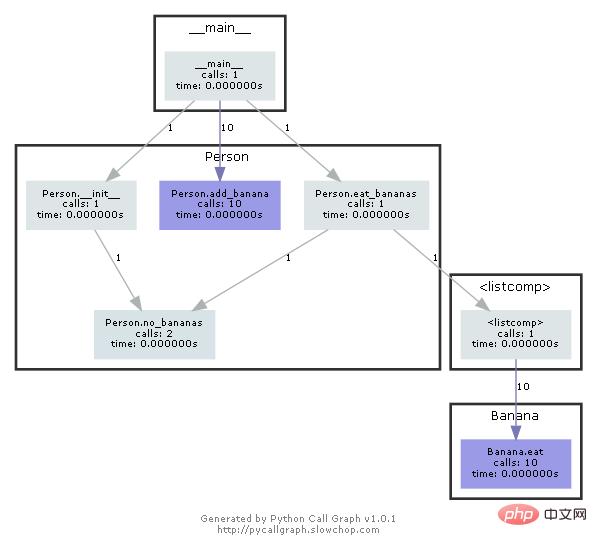
Run the above code and the basic.png image file will be generated in the current directory

From the generated image You can clearly see the running process of the entire code, from the main code block to the initialization of each class.
Let’s take another more complicated example:
import re
from pycallgraph import PyCallGraph
from pycallgraph import Config
from pycallgraph.output import GraphvizOutput
def main():
 graphviz = GraphvizOutput()
 graphviz.output_file = 'regexp.png'
 config = Config(include_stdlib=True)
 with PyCallGraph(output=graphviz, config=config):
 reo = compile()
 match(reo)
def compile():
 return re.compile('^[abetors]*$')
def match(reo):
 [reo.match(a) for a in words()]
def words():
 return [
 'abbreviation',
 'abbreviations',
 'abettor',
 'abettors',
 'abilities',
 'ability',
 'abrasion',
 'abrasions',
 'abrasive',
 'abrasives',
 ]
if __name__ == '__main__':
 main()
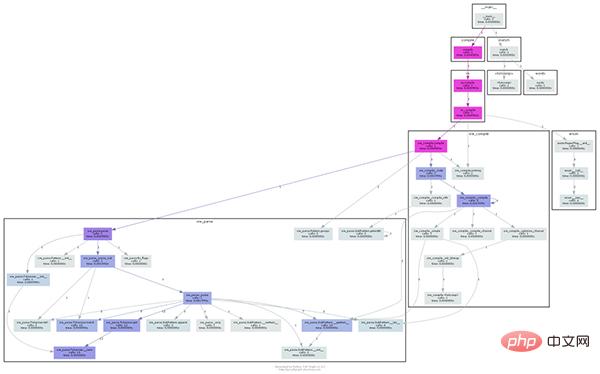
The code is also irresponsible, but the re regular is called inside the compiler. Let’s take a look at the final generated picture:

You can see that the entire code process is a lot more complicated because a lot of regular internal functions are called internally, but the whole thing is still very clear
It can be said that this god-level The third-party library is definitely good news for many Python enthusiasts, especially those who are just getting started in the Python field. When we encounter some unfamiliar and complex code blocks, we might as well use this library to try visualization and see if it can Get inspired from it~
The above is the detailed content of Artifact to easily visualize the Python program calling process. For more information, please follow other related articles on the PHP Chinese website!

