

 Backend DevelopmentPython TutorialShare a popular Python visualization module, easy and quick to get started! !
Share a popular Python visualization module, easy and quick to get started! !


What is Altair?
Altair is called a statistical visualization library because it can comprehensively understand, understand and analyze data through classification and aggregation, data transformation, data interaction, graphic composite, etc., and its installation process is also very simple. Simple, execute it directly through the pip command, as follows:
pip install altair
pip install vega_datasets
pip install altair_viewer
If you are using the conda package manager to install the Altair module, the code is as follows:
conda install -c conda-forge altair vega_datasets
First experience with Altair
Let's simply try to draw a histogram. First, create a DataFrame data set. The code is as follows:
df = pd.DataFrame({"brand":["iPhone","Xiaomi","HuaWei","Vivo"],
"profit(B)":[200,55,88,60]})
The next step is the code for drawing the histogram:
import altair as alt
import pandas as pd
import altair_viewer
chart = alt.Chart(df).mark_bar().encode(x="brand:N",y="profit(B):Q")
# 展示数据,调用display()方法
altair_viewer.display(chart,inline=True)
output
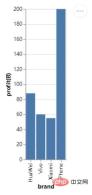
From the perspective of the entire syntax structure, first use alt.Chart() to specify the data set to be used, then use the instance method mark_*() to draw the chart style, and finally specify the X-axis and the data represented by the Y-axis. You may be curious about what N and Q represent respectively. This is the abbreviation of the variable type. In other words, the Altair module needs to understand the variable types involved in drawing graphics. Only In this way, the drawn graphics will be the effect we expect.
N represents a nominal variable (Nominal). For example, the brands of mobile phones are all proper nouns, while Q represents a numerical variable (Quantitative), which can be divided into discrete data. (discrete) and continuous data (continuous), in addition to time series data, the abbreviation is T and ordinal variables (O), for example, the rating of a merchant during the online shopping process has 1-5 stars. .
Saving the chart
To save the final chart, we can directly call the save() method to save the object as an HTML file. The code is as follows:
chart.save("chart.html")Also It can be saved as a JSON file, which is very similar from the code point of view.
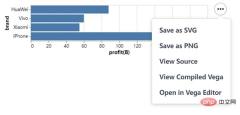
chart.save("chart.json")Of course we can also save files in image format, as shown below:
Advanced Operations of Altair
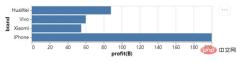
We On the basis of the above, further derivation and expansion, for example, we want to draw a horizontal bar chart and exchange data on the X-axis and Y-axis. The code is as follows:
chart = alt.Chart(df).mark_bar().encode(x="profit(B):Q", y="brand:N")
chart.save("chart1.html")
output
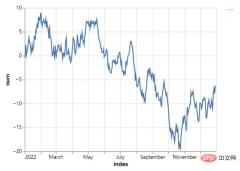
At the same time, we also try to draw a line chart. The mark_line() method is called and the code is as follows:
## 创建一组新的数据,以日期为行索引值
np.random.seed(29)
value = np.random.randn(365)
data = np.cumsum(value)
date = pd.date_range(start="20220101", end="20221231")
df = pd.DataFrame({"num": data}, index=date)
line_chart = alt.Chart(df.reset_index()).mark_line().encode(x="index:T", y="num:Q")
line_chart.save("chart2.html")
output
We can also draw a Gantt chart, which is usually used more in project management. The X-axis adds time and date, while the Y-axis represents the progress of the project. Code As follows:
project = [{"project": "Proj1", "start_time": "2022-01-16", "end_time": "2022-03-20"},
{"project": "Proj2", "start_time": "2022-04-12", "end_time": "2022-11-20"},
......
]
df = alt.Data(values=project)
chart = alt.Chart(df).mark_bar().encode(
 alt.X("start_time:T",
 axis=alt.Axis(format="%x",
 formatType="time",
 tickCount=3),
 scale=alt.Scale(domain=[alt.DateTime(year=2022, month=1, date=1),
 alt.DateTime(year=2022, month=12, date=1)])),
 alt.X2("end_time:T"),
 alt.Y("project:N", axis=alt.Axis(labelAlign="left",
labelFontSize=15,
labelOffset=0,
labelPadding=50)),
 color=alt.Color("project:N", legend=alt.Legend(labelFontSize=12,
symbolOpacity=0.7,
titleFontSize=15)))
chart.save("chart_gantt.html")
output
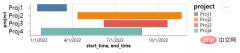
From the picture above, we can see several projects being worked on by the team. The progress of each project is different, of course. Well, the time span of different projects is also different, which is very intuitive when displayed on the chart.
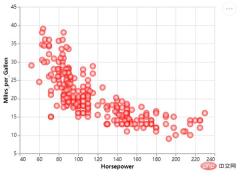
Next, we draw the scatter plot again, calling the mark_circle() method, the code is as follows:
df = data.cars()
## 筛选出地区是“USA”也就是美国的乘用车数据
df_1 = alt.Chart(df).transform_filter(
 alt.datum.Origin == "USA"
)
df = data.cars()
df_1 = alt.Chart(df).transform_filter(
 alt.datum.Origin == "USA"
)
chart = df_1.mark_circle().encode(
 alt.X("Horsepower:Q"),
 alt.Y("Miles_per_Gallon:Q")
)
chart.save("chart_dots.html")
output

Of course, we can further optimize it to make the chart more beautiful and add some colors. The code is as follows:
chart = df_1.mark_circle(color=alt.RadialGradient("radial",[alt.GradientStop("white", 0.0),
alt.GradientStop("red", 1.0)]),
 size=160).encode(
 alt.X("Horsepower:Q", scale=alt.Scale(zero=False,padding=20)),
 alt.Y("Miles_per_Gallon:Q", scale=alt.Scale(zero=False,padding=20))
)
output
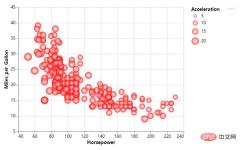
We change the scatter The size of the points. The sizes of different scatter points represent different values. The code is as follows:
chart = df_1.mark_circle(color=alt.RadialGradient("radial",[alt.GradientStop("white", 0.0),
alt.GradientStop("red", 1.0)]),
 size=160).encode(
 alt.X("Horsepower:Q", scale=alt.Scale(zero=False, padding=20)),
 alt.Y("Miles_per_Gallon:Q", scale=alt.Scale(zero=False, padding=20)),
 size="Acceleration:Q"
)
output
The above is the detailed content of Share a popular Python visualization module, easy and quick to get started! !. For more information, please follow other related articles on the PHP Chinese website!

 Learning Python: Is 2 Hours of Daily Study Sufficient?Apr 18, 2025 am 12:22 AM
Is it enough to learn Python for two hours a day? It depends on your goals and learning methods. 1) Develop a clear learning plan, 2) Select appropriate learning resources and methods, 3) Practice and review and consolidate hands-on practice and review and consolidate, and you can gradually master the basic knowledge and advanced functions of Python during this period.
 Python for Web Development: Key ApplicationsApr 18, 2025 am 12:20 AM
Key applications of Python in web development include the use of Django and Flask frameworks, API development, data analysis and visualization, machine learning and AI, and performance optimization. 1. Django and Flask framework: Django is suitable for rapid development of complex applications, and Flask is suitable for small or highly customized projects. 2. API development: Use Flask or DjangoRESTFramework to build RESTfulAPI. 3. Data analysis and visualization: Use Python to process data and display it through the web interface. 4. Machine Learning and AI: Python is used to build intelligent web applications. 5. Performance optimization: optimized through asynchronous programming, caching and code
 Python vs. C : Exploring Performance and EfficiencyApr 18, 2025 am 12:20 AM
Python is better than C in development efficiency, but C is higher in execution performance. 1. Python's concise syntax and rich libraries improve development efficiency. 2.C's compilation-type characteristics and hardware control improve execution performance. When making a choice, you need to weigh the development speed and execution efficiency based on project needs.
 Python in Action: Real-World ExamplesApr 18, 2025 am 12:18 AM
Python's real-world applications include data analytics, web development, artificial intelligence and automation. 1) In data analysis, Python uses Pandas and Matplotlib to process and visualize data. 2) In web development, Django and Flask frameworks simplify the creation of web applications. 3) In the field of artificial intelligence, TensorFlow and PyTorch are used to build and train models. 4) In terms of automation, Python scripts can be used for tasks such as copying files.
 Python's Main Uses: A Comprehensive OverviewApr 18, 2025 am 12:18 AM
Python is widely used in data science, web development and automation scripting fields. 1) In data science, Python simplifies data processing and analysis through libraries such as NumPy and Pandas. 2) In web development, the Django and Flask frameworks enable developers to quickly build applications. 3) In automated scripts, Python's simplicity and standard library make it ideal.
 The Main Purpose of Python: Flexibility and Ease of UseApr 17, 2025 am 12:14 AM
Python's flexibility is reflected in multi-paradigm support and dynamic type systems, while ease of use comes from a simple syntax and rich standard library. 1. Flexibility: Supports object-oriented, functional and procedural programming, and dynamic type systems improve development efficiency. 2. Ease of use: The grammar is close to natural language, the standard library covers a wide range of functions, and simplifies the development process.
 Python: The Power of Versatile ProgrammingApr 17, 2025 am 12:09 AM
Python is highly favored for its simplicity and power, suitable for all needs from beginners to advanced developers. Its versatility is reflected in: 1) Easy to learn and use, simple syntax; 2) Rich libraries and frameworks, such as NumPy, Pandas, etc.; 3) Cross-platform support, which can be run on a variety of operating systems; 4) Suitable for scripting and automation tasks to improve work efficiency.
 Learning Python in 2 Hours a Day: A Practical GuideApr 17, 2025 am 12:05 AM
Yes, learn Python in two hours a day. 1. Develop a reasonable study plan, 2. Select the right learning resources, 3. Consolidate the knowledge learned through practice. These steps can help you master Python in a short time.


Hot AI Tools

Undresser.AI Undress
AI-powered app for creating realistic nude photos

AI Clothes Remover
Online AI tool for removing clothes from photos.

Undress AI Tool
Undress images for free

Clothoff.io
AI clothes remover

AI Hentai Generator
Generate AI Hentai for free.

Hot Article
Hot Tools

Safe Exam Browser
Safe Exam Browser is a secure browser environment for taking online exams securely. This software turns any computer into a secure workstation. It controls access to any utility and prevents students from using unauthorized resources.

WebStorm Mac version
Useful JavaScript development tools

SAP NetWeaver Server Adapter for Eclipse
Integrate Eclipse with SAP NetWeaver application server.

MinGW - Minimalist GNU for Windows
This project is in the process of being migrated to osdn.net/projects/mingw, you can continue to follow us there. MinGW: A native Windows port of the GNU Compiler Collection (GCC), freely distributable import libraries and header files for building native Windows applications; includes extensions to the MSVC runtime to support C99 functionality. All MinGW software can run on 64-bit Windows platforms.

Atom editor mac version download
The most popular open source editor

