
1. Introduction to Hema supply chain
1. Hema business model
Hema is a technologically innovative company, and it is also a consumption-driven company that returns to consumer values: buy it, buy it well, buy it conveniently, buy it with confidence, and buy it with confidence. happy.
Hema includes Hema Fresh, X Member Store, Hema Chaoyun, Hema Neighborhood and other business models. The core business model is online and offline integration, the fastest The O2O (Hema Fresh Food) model that delivers products to your home in 30 minutes.

2. Introduction to Hema’s business categories
Hema Ma selects global quality products and pursues the ultimate freshness; combined with category characteristics and consumer shopping experience expectations, it chooses the most efficient business model for different categories. Hema Fresh’s sales account for 60% to 70%, making it the core category. This category is characterized by high timeliness expected by users, and is very suitable for businesses like Hema Fresh that open stores near users.

3. Logistics and inventory costs of different supply chain models
Before considering what supply chain model to use, logistics costs and inventory costs need to be balanced. For the same quantity of goods, the entire logistics cost is much lower than that of parcel logistics, and the cold chain difference is even more obvious (delivery timeliness and scale effects are not considered for the time being). On the contrary, the more dispersed the inventory, the greater the uncertainty in demand. If the consumer demand cannot be accurately grasped, the inventory will be placed in the store in advance, which will lead to high stockouts and losses, that is, high inventory costs.

4. Hema supply chain network
In order to achieve efficient supply and demand matching, multiple business models require supporting supply chain support. Hema's multiple business models are integrated at the backend and share trunk networks and inventory as much as possible, greatly improving resource utilization and improving supply chain efficiency.
2. Supply chain algorithm positioning
Supply chain algorithm is essentially based on traditional supply chain methods, using the power of algorithms and data to improve efficiency.
1. E-commerce industry supply chain algorithm positioning
# #E-commerce industry algorithms are mainly divided into basic algorithms and business algorithms.
Basic algorithms include images, speech, text, etc. E-commerce business algorithms are intuitively divided into three types. First, from the front end (traffic, user * product dimension), it is not much different from video websites and information websites, using search, advertising, and recommendation methods; second, from the middle end (retail , commodity dimension), including commodity, price and inventory prediction and decision-making algorithms; third, from the back-end (logistics, order dimension), including fulfillment, warehousing, distribution and other optimization algorithms. The broad supply chain algorithm includes mid-end (retail and commodity forecasting and decision-making) and back-end (logistics and order optimization), while the narrow supply chain algorithm only includes mid-end algorithms.
2. Advantages of retailer supply chain algorithm
The "bullwhip effect" refers to a phenomenon of demand variation amplification in the supply chain, which makes the information flow When transmitted from the final client to the original supplier, information sharing cannot be effectively realized, causing the information to be distorted and gradually amplified, resulting in greater and greater fluctuations in demand information. The amplification effect of this information distortion looks like a swing on the graph. The bullwhip effect is therefore vividly called the "bullwhip effect".
Retailers are the enterprises closest to consumers, best able to perceive and grasp consumer needs, and most capable of responding to market fluctuations through data and algorithms.

3. Hema supply chain algorithm logic
Retailing is essentially the matching of people and goods. In the daily operation of the enterprise, first of all, the company will launch a sales plan and strategy. The sales plan determines the supply, and the supply capacity determines the inventory. The short-term sales ceiling is determined through inventory and fulfillment capacity, thereby regulating sales. Next The sales plan of the wheel refers to the above historical information to achieve a complete closed loop of commercial operation.

##3. Fresh food automatic replenishment system
1. Background of Hema fresh food automatic replenishment
High-quality products are Hema’s consistent pursuit. In order to satisfy customers' ultimate freshness experience, Hema products have a very short shelf life and even provide a one-day-only series of daily fresh products that only meet daily needs, covering daily consumer categories such as milk, vegetables, meat and poultry, etc., becoming an industry leader. Benchmark. Instant fresh food service is very in line with consumer demand, but it also places high demands on the supply chain.
A shorter sales period means that out-of-stock or loss is more likely to occur. In this regard, the Hema supply chain algorithm considers Factors such as weather, seasonality, holidays, product substitution, marketing activities, online and offline displays, etc. have been used to build a series of high-precision demand forecast models with Hema characteristics, and the inventory is optimized through the simulation system to achieve a highly automated ordering system. , significantly reducing labor costs while optimizing inventory indicators.
2. Hema fresh food automatic replenishment system algorithm module
Hema fresh food replenishment system includes demand forecast, inventory model, Dynamically control three modules. The demand forecast part accounts for the largest workload due to the large amount of data and complex feature processing; the main purpose of the inventory model is to balance user needs and inventory costs to maximize benefits; dynamic control automatically generates marketing activities for products that do not meet sales expectations And flow control, reduce inventory levels, optimize turnover and losses.
In terms of technical depth and innovation, the spatiotemporal heterogeneous graph neural network model has been successfully introduced into product sales forecasting needs, which has solved the problem of excessive information loss in complex marketing activities and significantly improved the prediction accuracy.
In terms of algorithm effect, the Hema prediction algorithm won the championship and runner-up in the main data set of the Alibaba Group time series prediction competition. Results, overall accuracy is high and versatility is strong.
In terms of business results, the adoption rate of fresh food ordering system algorithm recommendations has stabilized at over 96%, and ordering efficiency has increased by 70% , the loss rate is reduced by 30%, and the out-of-stock rate is reduced by 25%. In terms of industry influence, Hema’s algorithm solution integrating forecasting, inventory, price and control was successfully shortlisted for the 2022 Franz Edelman Outstanding Achievement Award Finals. 
4. Hema sales forecast algorithm iteration path
Hema The iteration path of the sales forecast algorithm is divided into four stages: simple model, machine learning model, deep time series model, and spatiotemporal graph network model. The simple model is close to business understanding and ensures coverage of all SKUs; the machine learning model is relatively stable and has fewer outliers, but relies heavily on feature engineering and has poor timing scalability; the deep timing model does not rely on feature factories, has less original timing information missing, and has strong timing scalability. ; The spatio-temporal graph network model considers the correlation between commodities and the influence between samples.

5. Ten Difficulties in Hema Sales Forecast

6. Spatio-temporal heterogeneous graph neural network sales forecast model framework
When forecasting, the main information for forecasting is product sales, considering Since activities have an impact on product sales, a graph relationship can be established between products and activities. In addition, other factors that have an impact on product sales can also be included in the graph model. For this model, in each time window, a A heterogeneous picture of product sales and various characteristics is drawn. During the calculation process, algorithms such as GraphSage and GATNE are first used to extract graph information on each time slice, thereby obtaining point update information, and then passing it down to obtain the entire time series information. In practical applications, graph information is auxiliary information, and the main information is still timing information; at the same time, timing models can be replaced with different timing models according to different scenarios.

7. Inventory model based on simulation
The inventory model is mainly divided into There are two parts, the first is the inventory of a single SKU, and the second is the summary of multiple warehouses. A unique scenario for new retail. The safety reserve refers to when online and offline share inventory. Online customers place orders first and then take the physical items, while offline customers take the physical items first and then place orders. This will cause online The problem is that the goods ordered first by online customers are taken away by offline users, resulting in online orders being unable to be fulfilled. Therefore, in such a scenario, it is necessary to control parameters. When the inventory is less than a certain value, sales will not be carried out online to prevent the risk of being unable to ship in time.

8. Inventory algorithm system architecture
is making order quantity decisions The process is mainly divided into three steps. The first is to split the business goals, and determine whether a certain product should focus on ensuring out-of-stock or loss protection based on differences in business goals and scenarios. The second step is to infer inventory batches. For example, in our warehouse There are 10 items, 5 of which are close-to-date products. If the order is not ordered in time, there may be out-of-stock due to the expiration of the close-to-date products, so inventory batch inference is required; the third step is the calculation of optimal order quantity, which supports various The model is used to estimate order quantities.

9. Inventory dynamic control system
Due to the short shelf life of fresh products, although the sales forecast and inventory model will maximize the model performance, they still There are cases where a small amount of goods are ordered too much or too little, especially when ordering too much will cause a lot of losses. Therefore, by establishing a dynamic inventory control system, we can monitor sales in real time and update forecast results, conduct inventory warnings, and adjust inventory through online promotions, APP traffic tilt, and offline store discounts to try to avoid losses caused by inventory backlog. The difficulty of this system lies in the joint regulation of flow and price, which requires global optimization of high-frequency flow decisions and low-frequency price decisions.

#4. Q&A session
Q1: What are the prediction evaluation criteria?
A1: The industry usually uses weighted MAPE, that is, accuracy = 1-(total error of the product pool/total true sales)*100%. This error is weighted. For example, if the actual sales volume of a certain product is large, the error will be large and the contribution to the global error will be large, which is in line with business understanding.
#Q2: Space-time heterogeneous graph paper link?
A2: Mainly refer to the idea of this space-time isomorphic graph paper, combined with its own scene, using heterogeneous graphs. Huang Y, Bi H K, Li Z, et al. STGAT: Modeling spatial-temporal interactions for human trajectory prediction[C]//Proceedings of the IEEE International Conference on Computer Vision. 2019: 6272-6281.
Q3: Which one is used for the simple model? Will it be used as a benchmark for other models and be considered added value?
#A3: It is not the key to use a simple model, the main thing is that it can cover all SKUs and be used for the bottom-up strategy. Common ones include simple moving average method, same period last week, etc.
The above is the detailed content of Hema supply chain algorithm in practice. For more information, please follow other related articles on the PHP Chinese website!
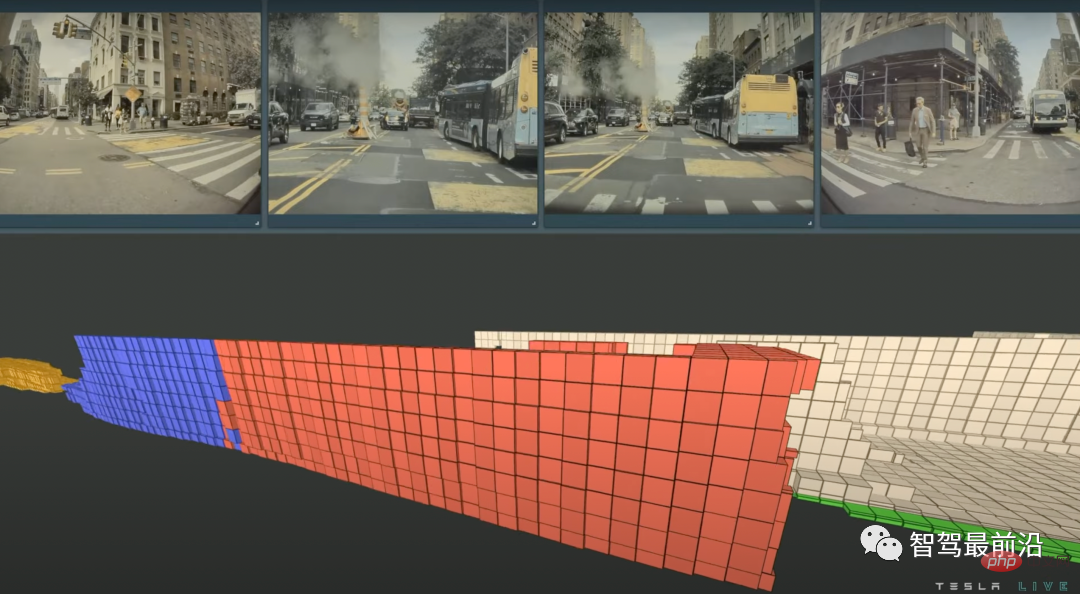 特斯拉自动驾驶算法和模型解读Apr 11, 2023 pm 12:04 PM
特斯拉是一个典型的AI公司,过去一年训练了75000个神经网络,意味着每8分钟就要出一个新的模型,共有281个模型用到了特斯拉的车上。接下来我们分几个方面来解读特斯拉FSD的算法和模型进展。01 感知 Occupancy Network特斯拉今年在感知方面的一个重点技术是Occupancy Network (占据网络)。研究机器人技术的同学肯定对occupancy grid不会陌生,occupancy表示空间中每个3D体素(voxel)是否被占据,可以是0/1二元表示,也可以是[0, 1]之间的
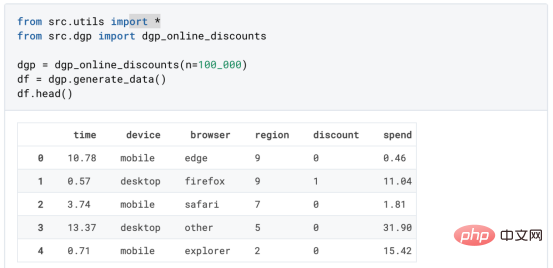 基于因果森林算法的决策定位应用Apr 08, 2023 am 11:21 AM
译者 | 朱先忠审校 | 孙淑娟在我之前的博客中,我们已经了解了如何使用因果树来评估政策的异质处理效应。如果你还没有阅读过,我建议你在阅读本文前先读一遍,因为我们在本文中认为你已经了解了此文中的部分与本文相关的内容。为什么是异质处理效应(HTE:heterogenous treatment effects)呢?首先,对异质处理效应的估计允许我们根据它们的预期结果(疾病、公司收入、客户满意度等)选择提供处理(药物、广告、产品等)的用户(患者、用户、客户等)。换句话说,估计HTE有助于我
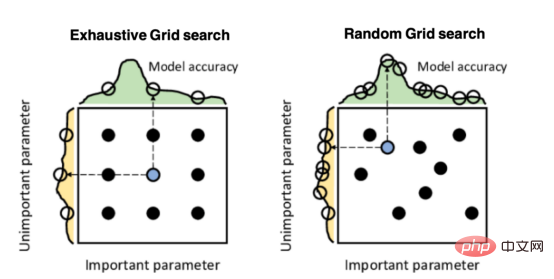 Mango:基于Python环境的贝叶斯优化新方法Apr 08, 2023 pm 12:44 PM
译者 | 朱先忠审校 | 孙淑娟引言模型超参数(或模型设置)的优化可能是训练机器学习算法中最重要的一步,因为它可以找到最小化模型损失函数的最佳参数。这一步对于构建不易过拟合的泛化模型也是必不可少的。优化模型超参数的最著名技术是穷举网格搜索和随机网格搜索。在第一种方法中,搜索空间被定义为跨越每个模型超参数的域的网格。通过在网格的每个点上训练模型来获得最优超参数。尽管网格搜索非常容易实现,但它在计算上变得昂贵,尤其是当要优化的变量数量很大时。另一方面,随机网格搜索是一种更快的优化方法,可以提供更好的
 因果推断主要技术思想与方法总结Apr 12, 2023 am 08:10 AM
导读:因果推断是数据科学的一个重要分支,在互联网和工业界的产品迭代、算法和激励策略的评估中都扮演者重要的角色,结合数据、实验或者统计计量模型来计算新的改变带来的收益,是决策制定的基础。然而,因果推断并不是一件简单的事情。首先,在日常生活中,人们常常把相关和因果混为一谈。相关往往代表着两个变量具有同时增长或者降低的趋势,但是因果意味着我们想要知道对一个变量施加改变的时候会发生什么样的结果,或者说我们期望得到反事实的结果,如果过去做了不一样的动作,未来是否会发生改变?然而难点在于,反事实的数据往往是
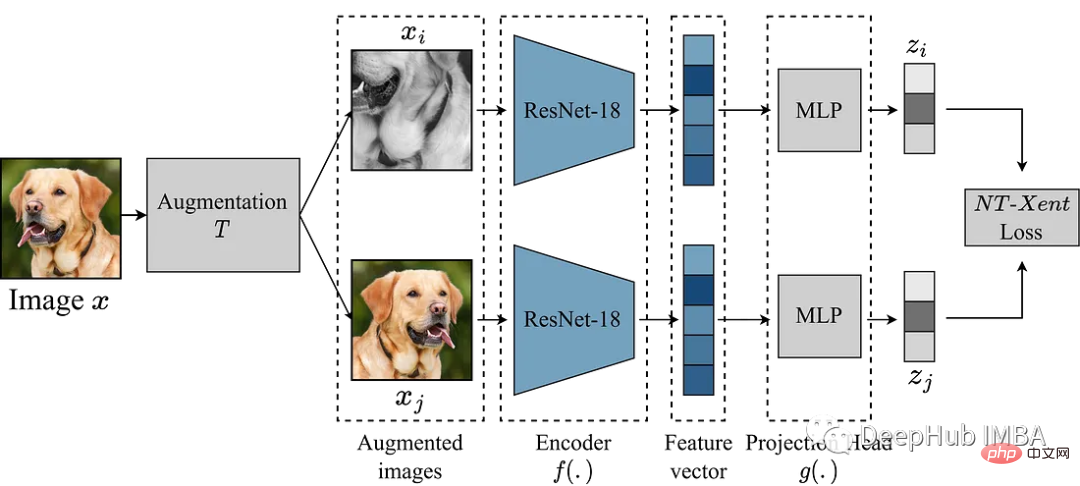 使用Pytorch实现对比学习SimCLR 进行自监督预训练Apr 10, 2023 pm 02:11 PM
SimCLR(Simple Framework for Contrastive Learning of Representations)是一种学习图像表示的自监督技术。 与传统的监督学习方法不同,SimCLR 不依赖标记数据来学习有用的表示。 它利用对比学习框架来学习一组有用的特征,这些特征可以从未标记的图像中捕获高级语义信息。SimCLR 已被证明在各种图像分类基准上优于最先进的无监督学习方法。 并且它学习到的表示可以很容易地转移到下游任务,例如对象检测、语义分割和小样本学习,只需在较小的标记
 盒马供应链算法实战Apr 10, 2023 pm 09:11 PM
一、盒马供应链介绍1、盒马商业模式盒马是一个技术创新的公司,更是一个消费驱动的公司,回归消费者价值:买的到、买的好、买的方便、买的放心、买的开心。盒马包含盒马鲜生、X 会员店、盒马超云、盒马邻里等多种业务模式,其中最核心的商业模式是线上线下一体化,最快 30 分钟到家的 O2O(即盒马鲜生)模式。2、盒马经营品类介绍盒马精选全球品质商品,追求极致新鲜;结合品类特点和消费者购物体验预期,为不同品类选择最为高效的经营模式。盒马生鲜的销售占比达 60%~70%,是最核心的品类,该品类的特点是用户预期时
 机器学习必知必会十大算法!Apr 12, 2023 am 09:34 AM
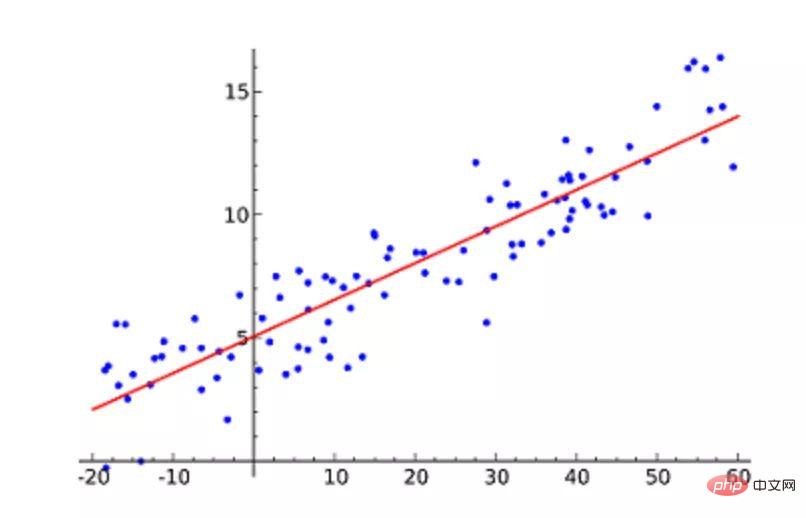
1.线性回归线性回归(Linear Regression)可能是最流行的机器学习算法。线性回归就是要找一条直线,并且让这条直线尽可能地拟合散点图中的数据点。它试图通过将直线方程与该数据拟合来表示自变量(x 值)和数值结果(y 值)。然后就可以用这条线来预测未来的值!这种算法最常用的技术是最小二乘法(Least of squares)。这个方法计算出最佳拟合线,以使得与直线上每个数据点的垂直距离最小。总距离是所有数据点的垂直距离(绿线)的平方和。其思想是通过最小化这个平方误差或距离来拟合模型。例如
 人类反超 AI:DeepMind 用 AI 打破矩阵乘法计算速度 50 年记录一周后,数学家再次刷新Apr 11, 2023 pm 01:16 PM
10 月 5 日,AlphaTensor 横空出世,DeepMind 宣布其解决了数学领域 50 年来一个悬而未决的数学算法问题,即矩阵乘法。AlphaTensor 成为首个用于为矩阵乘法等数学问题发现新颖、高效且可证明正确的算法的 AI 系统。论文《Discovering faster matrix multiplication algorithms with reinforcement learning》也登上了 Nature 封面。然而,AlphaTensor 的记录仅保持了一周,便被人类


Hot AI Tools

Undresser.AI Undress
AI-powered app for creating realistic nude photos

AI Clothes Remover
Online AI tool for removing clothes from photos.

Undress AI Tool
Undress images for free

Clothoff.io
AI clothes remover

AI Hentai Generator
Generate AI Hentai for free.

Hot Article

Hot Tools

SublimeText3 Chinese version
Chinese version, very easy to use

mPDF
mPDF is a PHP library that can generate PDF files from UTF-8 encoded HTML. The original author, Ian Back, wrote mPDF to output PDF files "on the fly" from his website and handle different languages. It is slower than original scripts like HTML2FPDF and produces larger files when using Unicode fonts, but supports CSS styles etc. and has a lot of enhancements. Supports almost all languages, including RTL (Arabic and Hebrew) and CJK (Chinese, Japanese and Korean). Supports nested block-level elements (such as P, DIV),

SublimeText3 Linux new version
SublimeText3 Linux latest version

MantisBT
Mantis is an easy-to-deploy web-based defect tracking tool designed to aid in product defect tracking. It requires PHP, MySQL and a web server. Check out our demo and hosting services.

SAP NetWeaver Server Adapter for Eclipse
Integrate Eclipse with SAP NetWeaver application server.


