


Another machine learning model interpretation artifact: Shapash


What is Shapash
Model interpretability and understandability have been the focus of many research papers and open source projects . And many projects are staffed with data experts and trained professionals.
Shapash works with most sklearn, lightgbm, xgboost, catboost models and can be used for classification and regression tasks. It utilizes the Shap backend to calculate the local contribution of features, however, this can be replaced by some other strategy for calculating local contribution. Data scientists can leverage the Shapash interpreter to investigate and troubleshoot their models, or deploy it to provide visualizations of each inference. And it can also be used to make web applications that can bring huge value to end customers and entrepreneurs.

shabash library
Goals of Shapash
1. Display clear and reasonable results
Plotting and output use every Tags for each component and its pattern:

2. Web Application
Data scientists can easily explore between global and local neighborhoods by using a web application to quickly understand their model and understand how various key points work:
shapash library webapp
3. Summary and export Explanation
Shapash presents a short and clear explanation. It allows every customer, no matter what their background, to understand a clear explanation of the hosting model because the Shapash features are summarized and clearly explained.

4. Complete data science report
The complete data report can be viewed here: https://shapash-demo.ossbymaif.fr/
Shapash functions
Some functions of Shapash are as follows:
1. Machine learning model: It is suitable for classification (binary or multi-class problems) and regression problems. It supports multiple models such as Catboost, Xgboost, LightGBM, Sklearn Ensemble, linear models, and SVM.
2. Feature encoding: It supports a large number of encoding techniques to process categorical features in our data set, such as one-hot encoding, ordinal encoding, Base N encoding, target encoding or binary encoding, etc.
3.SklearnColumnTransformer: OneHotEncoder, OrdinalEncoder, StandardScaler, QuantileTransformer or PowerTransformer
4.Visualization: Provides a set of visual effects to easily explain your results and display understandable and clear results.
5. It is compatible with Lime and Shap. It uses the Shap backend to display results in just a few lines of code.
6. It provides many options for parameters to obtain results concisely.
7.Shapash is easy to install and use: It provides a SmartExplainer class to understand your model and summarize and clarify it with simple syntax.
8. Deployment: Investigation and deployment (via API or batch mode) of operational usage is important. Easily create web applications to navigate from global to local.
9. High versatility: To display the results, many arguments are required. But the more you do to clean and archive your data, the clearer the results will be for your end customers.

How Shapash works
Shapash is a Python library that makes machine learning easy to understand and interpret. Data enthusiasts can easily understand and share their models. Shapash uses Lime and Shap as a backend to display results in just a few lines of code. Shapash relies on various important advances in building machine learning models to make the results reasonable. The following figure shows the workflow of the shapash package:
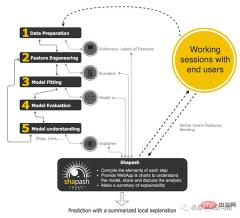
How Shapash works
How it works
- First, it compiles the elements of each step, such as data preparation, feature engineering, model fitting, model evaluation, and model understanding.
- Secondly, it provides a WebApp and diagrams to better understand the model. Model results can be shared and discussed with clients.
- Finally, it gives you a summary of interpretability.
Installation
You can install Shapash using the following code:
<span style="color: rgb(89, 89, 89); margin: 0px; padding: 0px; background: none 0% 0% / auto repeat scroll padding-box border-box rgba(0, 0, 0, 0);">pip</span> <span style="color: rgb(89, 89, 89); margin: 0px; padding: 0px; background: none 0% 0% / auto repeat scroll padding-box border-box rgba(0, 0, 0, 0);">install</span> <span style="color: rgb(89, 89, 89); margin: 0px; padding: 0px; background: none 0% 0% / auto repeat scroll padding-box border-box rgba(0, 0, 0, 0);">shapash</span>
For Jupyter Notebook: If you are using jupyter notebook and want to view inline graphs, then you Another command is required:
<span style="color: rgb(89, 89, 89); margin: 0px; padding: 0px; background: none 0% 0% / auto repeat scroll padding-box border-box rgba(0, 0, 0, 0);">pip</span> <span style="color: rgb(89, 89, 89); margin: 0px; padding: 0px; background: none 0% 0% / auto repeat scroll padding-box border-box rgba(0, 0, 0, 0);">install</span> <span style="color: rgb(89, 89, 89); margin: 0px; padding: 0px; background: none 0% 0% / auto repeat scroll padding-box border-box rgba(0, 0, 0, 0);">ipywidgets</span>
Getting Started
Here we will explore Shapash using the dataset House Price Prediction. This is a regression problem and we have to predict house prices. First we analyze the dataset, including univariate and bivariate analyses, then model interpretability using feature importance, feature contribution, local and comparison plots, then model performance, and finally WebApp.
Analyzing Data Set
Univariate Analysis
Use You can view the image below to understand the element named First Floor Square Feet. We can see a table that shows various statistics for our training and test datasets, such as mean, maximum, minimum, standard deviation, median, and more. In the figure on the right you can see the distribution plots of the training and test data sets. Shapash also mentions whether our features are categorical or numeric and it also provides a drop-down option where all features are available.

Univariate analysis
For categorical features, the training and test datasets show non-duplicate and missing values. On the right, a bar chart is shown showing the percentage of the corresponding category in each feature.

Categories in Features
Goal Analysis
You can also see the target named Sales Price Detailed analysis of variables. On the left, all statistics such as count, mean, standard deviation, minimum, maximum, median, etc. are shown for training and prediction datasets. On the right, the distributions of the training and prediction datasets are shown.
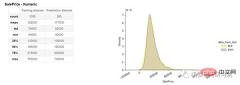
Objective analysis
Multivariate analysis
We discussed univariate analysis in detail above. In this section we will look at multivariate analysis. The following figure shows the correlation matrix for the first 20 features of the training and test datasets. The correlation scale is also shown based on different colors. This is how we use Shapash to visualize relationships between features.

Multivariate Analysis
Model Interpretability
Feature Importance Plot
Passed Using this library we can see the importance of this feature. Feature importance is a method of finding the importance of input features in predicting output values. The following figure shows the feature importance curve:
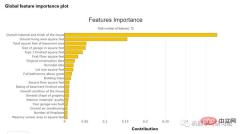
Feature Importance Plot
Feature Contribution Plot
These Curves help us answer questions like how does a feature affect my prediction, whether its contribution is positive or negative, etc. This diagram completes the importance of the interpretability of the model, the overall consistency of the model makes it more likely to understand the impact of features on the model.
We can see the contribution plots of numerical and categorical features.
For numerical features

Contribution graph
For categorical features
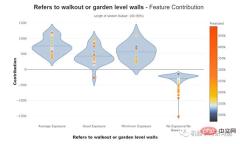
For classification features
Partial map
We can draw a local map. The following figure shows a partial diagram:

Partial diagram
Comparison diagram
We can draw a comparison diagram. The following image shows the comparison graph:

Comparison graph
Model Performance
After data analysis, we are training the machine learning model. The image below shows the output of our prediction. On the left, statistics such as count, minimum, maximum, median, standard deviation, etc. are shown for the true and predicted values. On the right, the distribution of predicted and actual values is shown.

Model Performance
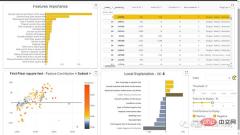
WebApp
After model training, we can also build a WebApp. This web app shows a complete dashboard of our data, including what we've covered so far. The image below shows the dashboard.

WebApp
Project address: https://github.com/MAIF/shapash
Write at the end
This article briefly introduces the basic functions and drawing display of shapash. I believe everyone has a certain understanding of this python library.
The above is the detailed content of Another machine learning model interpretation artifact: Shapash. For more information, please follow other related articles on the PHP Chinese website!

 Google Versus OpenAI: The AI Fight For StudentsApr 18, 2025 am 11:31 AM
Immediate Impact versus Long-Term Partnership? Two weeks ago OpenAI stepped forward with a powerful short-term offer, granting U.S. and Canadian college students free access to ChatGPT Plus through the end of May 2025. This tool includes GPT‑4o, an a
 5 Ways To Leverage AI And Crush Your Next Job InterviewApr 18, 2025 am 11:30 AM
According to a survey by Resume Builder, 51% of companies already use AI tools in their hiring processes—expected to jump to 68% by the end of 2025. You aren't just gaining an edge by leveraging AI solutions to prepare for your next job interview. Yo
 8 Major Problems With AI Initiatives In EnterpriseApr 18, 2025 am 11:29 AM
With so much enthusiasm about the rapid advancement we’ve made in using LLMs this year, some of the remaining barriers and bottlenecks tend to get lost in the shuffle. As with all prior technologies, companies have to introduce an AI project t
 Avoid These 5 Common Mistakes in AI that Every Novice MakesApr 18, 2025 am 11:25 AM
Embarking on your AI journey? Avoid these common pitfalls! This guide highlights five frequent mistakes beginners make and offers solutions for a smoother, more successful learning experience. Key Takeaways: Master the AI fundamentals before tackl
 Tech With Respect: AI And Indigenous Community PowerApr 18, 2025 am 11:21 AM
The answer is complex. AI carries tremendous potential to support Indigenous self-determination, language preservation, and climate stewardship. But it also risks deepening long-standing patterns of erasure, exploitation, and exclusion — unless it is
 Impact of Virtual AI Agents on Digital Product ExperiencesApr 18, 2025 am 11:13 AM
Revolutionizing Customer Service: The Rise of Virtual AI Agents in Integrated Information Systems In today's rapidly evolving digital landscape, businesses are constantly seeking innovative ways to enhance customer communication. The integration of
 Google Guilty Again, Meta On Trial, OpenAI Social, IR Rolls Up Touchcast AIApr 18, 2025 am 11:10 AM
On April 17, 2025, U.S. District Judge Leonie Brinkema ruled that Google has illegally monopolized key segments of the digital advertising market. The court determined that Google abused its dominance by tying its publisher ad server and ad exchange,
 AV Bytes: Weekly AI Innovations Featuring SearchGPT, Llama 3.1 and MoreApr 18, 2025 am 11:06 AM
A major breakthrough in the field of AI this week! AV Bytes brings you the latest progress in the AI field, and the excitement is not to be missed! The future of search engines? OpenAI's SearchGPT, Meta's Llama 3.1, and Mistral AI's Large 2 model all push AI to new heights. In addition, AI won medals in the Mathematics Olympiad and showed potential beyond human physicians in the field of medical diagnosis. All of this indicates that science fiction is gradually becoming a reality! Highlights of the week: OpenAI's SearchGPT: A new search engine prototype that uses advanced natural language processing technology to improve information retrieval efficiency. Meta's Llama 3.1: Embrace


Hot AI Tools

Undresser.AI Undress
AI-powered app for creating realistic nude photos

AI Clothes Remover
Online AI tool for removing clothes from photos.

Undress AI Tool
Undress images for free

Clothoff.io
AI clothes remover

AI Hentai Generator
Generate AI Hentai for free.

Hot Article
Hot Tools

Dreamweaver Mac version
Visual web development tools

PhpStorm Mac version
The latest (2018.2.1) professional PHP integrated development tool

MantisBT
Mantis is an easy-to-deploy web-based defect tracking tool designed to aid in product defect tracking. It requires PHP, MySQL and a web server. Check out our demo and hosting services.

SAP NetWeaver Server Adapter for Eclipse
Integrate Eclipse with SAP NetWeaver application server.

WebStorm Mac version
Useful JavaScript development tools

