

 Technology peripheralsAISummary of important knowledge points related to machine learning regression models
1. What are the assumptions of linear regression?
Linear regression has four assumptions:
- Linear: There should be a linear relationship between the independent variable (x) and the dependent variable (y), which means that changes in the x value also should change the y value in the same direction.
- Independence: Features should be independent of each other, which means minimal multicollinearity.
- Normality: Residuals should be normally distributed.
- Homoskedasticity: The variance of the data points around the regression line should be the same for all values.
2. What is residual and how is it used to evaluate regression models?
The residual refers to the error between the predicted value and the observed value. It measures the distance of the data points from the regression line. It is calculated by subtracting predicted values from observed values.
Residual plots are a good way to evaluate regression models. It is a graph that shows all the residuals on the vertical axis and the features on the x-axis. If the data points are randomly scattered on lines with no pattern, then a linear regression model fits the data well, otherwise we should use a nonlinear model.

3. How to distinguish between linear regression model and nonlinear regression model?
Both are types of regression problems. The difference between the two is the data they are trained on.
The linear regression model assumes a linear relationship between features and labels, which means if we take all the data points and plot them into a linear (straight) line it should fit the data.
Nonlinear regression models assume that there is no linear relationship between variables. Nonlinear (curvilinear) lines should separate and fit the data correctly.

Three best ways to find out if your data is linear or non-linear -
- Residual plot
- Scatter points Figure
- Assuming the data is linear, a linear model is trained and evaluated by accuracy.
4. What is multicollinearity and how does it affect model performance?
Multicollinearity occurs when certain features are highly correlated with each other. Correlation refers to a measure that indicates how one variable is affected by changes in another variable.
If an increase in feature a leads to an increase in feature b, then the two features are positively correlated. If an increase in a causes a decrease in feature b, then the two features are negatively correlated. Having two highly correlated variables on the training data will lead to multicollinearity as its model cannot find patterns in the data, resulting in poor model performance. Therefore, before training the model, we must first try to eliminate multicollinearity.
5. How do outliers affect the performance of linear regression models?
Outliers are data points whose values differ from the average range of the data points. In other words, these points are different from the data or outside the 3rd criterion.

# Linear regression models attempt to find a best-fit line that reduces residuals. If the data contains outliers, the line of best fit will shift a bit toward the outliers, increasing the error rate and resulting in a model with a very high MSE.
6. What is the difference between MSE and MAE?
MSE stands for mean square error, which is the squared difference between the actual value and the predicted value. And MAE is the absolute difference between the target value and the predicted value.
MSE penalizes big mistakes, MAE does not. As the values of both MSE and MAE decrease, the model tends to a better fitting line.
7. What are L1 and L2 regularization and when should they be used?
In machine learning, our main goal is to create a general model that can perform better on training and test data, but when there is very little data, basic linear regression models tend to overfit. together, so we will use l1 and l2 regularization.
L1 regularization or lasso regression works by adding the absolute value of the slope as a penalty term within the cost function. Helps remove outliers by removing all data points with slope values less than a threshold.
L2 regularization or ridge regression adds a penalty term equal to the square of the coefficient size. It penalizes features with higher slope values.
l1 and l2 are useful when the training data is small, the variance is high, the predicted features are larger than the observed values, and multicollinearity exists in the data.
8. What does heteroskedasticity mean?
It refers to the situation where the variances of the data points around the best-fit line are different within a range. It results in uneven dispersion of residuals. If it is present in the data, then the model tends to predict invalid output. One of the best ways to test for heteroskedasticity is to plot the residuals.
One of the biggest causes of heteroskedasticity within data is the large differences between range features. For example, if we have a column from 1 to 100000, then increasing the values by 10% will not change the lower values, but will make a very large difference at the higher values, thus producing a large variance difference. data point.
9. What is the role of the variance inflation factor?
The variance inflation factor (vif) is used to find out how well an independent variable can be predicted using other independent variables.
Let's take example data with features v1, v2, v3, v4, v5 and v6. Now, to calculate the vif of v1, consider it as a predictor variable and try to predict it using all other predictor variables.
If the value of VIF is small, it is better to remove the variable from the data. Because smaller values indicate high correlation between variables.
10. How does stepwise regression work?
Stepwise regression is a method of creating a regression model by removing or adding predictor variables with the help of hypothesis testing. It predicts the dependent variable by iteratively testing the significance of each independent variable and removing or adding some features after each iteration. It runs n times and tries to find the best combination of parameters that predicts the dependent variable with the smallest error between the observed and predicted values.
It can manage large amounts of data very efficiently and solve high-dimensional problems.
11. In addition to MSE and MAE, are there any other important regression indicators?

We use a regression problem to introduce these indicators, where our input is work experience and the output is salary. The graph below shows a linear regression line drawn to predict salary.

1. Mean absolute error (MAE):

Mean absolute error (MAE) is the simplest regression measure. It adds the difference between each actual and predicted value and divides it by the number of observations. In order for a regression model to be considered a good model, the MAE should be as small as possible.
The advantages of MAE are:
Simple and easy to understand. The result will have the same units as the output. For example: If the unit of the output column is LPA, then if the MAE is 1.2, then we can interpret the result as 1.2LPA or -1.2LPA, MAE is relatively stable to outliers (compared to some other regression indicators, MAE is affected by outliers smaller).
The disadvantage of MAE is:
MAE uses a modular function, but the modular function is not differentiable at all points, so it cannot be used as a loss function in many cases.
2. Mean square error (MSE):

MSE takes the difference between each actual value and the predicted value, then squares the difference and adds them together, finally dividing by the number of observations. In order for a regression model to be considered a good model, the MSE should be as small as possible.
Advantages of MSE: The square function is differentiable at all points, so it can be used as a loss function.
Disadvantages of MSE: Since MSE uses the square function, the unit of the result is the square of the output. It is therefore difficult to interpret the results. Since it uses a square function, if there are outliers in the data, the differences will also be squared, and therefore, MSE is not stable for outliers.
3. Root mean square error (RMSE):

The root mean square error (RMSE) takes the difference between each actual value and the predicted value values, then square the differences and add them, and finally divide by the number of observations. Then take the square root of the result. Therefore, RMSE is the square root of MSE. In order for a regression model to be considered a good model, the RMSE should be as small as possible.
RMSE solves the problem of MSE, the units will be the same as those of the output since it takes the square root, but is still less stable to outliers.
The above indicators depend on the context of the problem we are solving. We cannot judge the quality of the model by just looking at the values of MAE, MSE and RMSE without understanding the actual problem.
4, R2 score:

If we don’t have any input data, but want to know how much salary he can get in this company, then we can The best thing to do is give them an average of all employee salaries.

#R2 score gives a value between 0 and 1 and can be interpreted for any context. It can be understood as the quality of the fit.
SSR is the sum of squared errors of the regression line, and SSM is the sum of squared errors of the moving average. We compare the regression line to the mean line.

- #If the R2 score is 0, it means that our model has the same results as the average, so our model needs to be improved.
- If the R2 score is 1, the right-hand side of the equation becomes 0, which can only happen if our model fits each data point without error.
- If the R2 score is negative, it means the right side of the equation is greater than 1, which can happen when SSR > SSM. This means that our model is worst than the average, which means that our model is worse than taking the average to predict
If the R2 score of our model is 0.8, this means that it can be said that the model can Explains 80% of the output variance. That is, 80% of the wage variation can be explained by the input (working years), but the remaining 20% is unknown.
If our model has 2 features, working years and interview scores, then our model can explain 80% of the salary changes using these two input features.
Disadvantages of R2:
As the number of input features increases, R2 will tend to increase accordingly or remain unchanged, but will never decrease, even if the input features are not useful for our model important (e.g., adding the temperature on the day of the interview to our example, R2 will not decrease even if the temperature is not important to the output).
5. Adjusted R2 score:
In the above formula, R2 is R2, n is the number of observations (rows), and p is the number of independent features. Adjusted R2 solves the problems of R2.
When we add features that are less important to our model, like adding temperature to predict wages.....

When adding features that are important to the model, such as adding interview scores to predict salary...

The above is the regression problem Important knowledge points and the introduction of various important indicators used to solve regression problems and their advantages and disadvantages. I hope it will be helpful to you.
The above is the detailed content of Summary of important knowledge points related to machine learning regression models. For more information, please follow other related articles on the PHP Chinese website!

 从VAE到扩散模型:一文解读以文生图新范式Apr 08, 2023 pm 08:41 PM
1 前言在发布DALL·E的15个月后,OpenAI在今年春天带了续作DALL·E 2,以其更加惊艳的效果和丰富的可玩性迅速占领了各大AI社区的头条。近年来,随着生成对抗网络(GAN)、变分自编码器(VAE)、扩散模型(Diffusion models)的出现,深度学习已向世人展现其强大的图像生成能力;加上GPT-3、BERT等NLP模型的成功,人类正逐步打破文本和图像的信息界限。在DALL·E 2中,只需输入简单的文本(prompt),它就可以生成多张1024*1024的高清图像。这些图像甚至
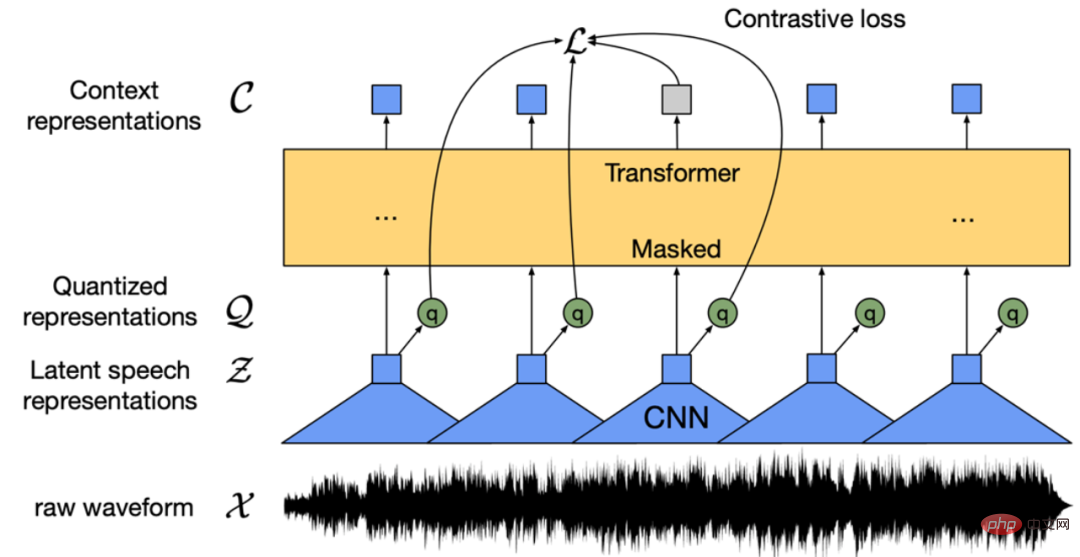 找不到中文语音预训练模型?中文版 Wav2vec 2.0和HuBERT来了Apr 08, 2023 pm 06:21 PM
Wav2vec 2.0 [1],HuBERT [2] 和 WavLM [3] 等语音预训练模型,通过在多达上万小时的无标注语音数据(如 Libri-light )上的自监督学习,显著提升了自动语音识别(Automatic Speech Recognition, ASR),语音合成(Text-to-speech, TTS)和语音转换(Voice Conversation,VC)等语音下游任务的性能。然而这些模型都没有公开的中文版本,不便于应用在中文语音研究场景。 WenetSpeech [4] 是
 普林斯顿陈丹琦:如何让「大模型」变小Apr 08, 2023 pm 04:01 PM
“Making large models smaller”这是很多语言模型研究人员的学术追求,针对大模型昂贵的环境和训练成本,陈丹琦在智源大会青源学术年会上做了题为“Making large models smaller”的特邀报告。报告中重点提及了基于记忆增强的TRIME算法和基于粗细粒度联合剪枝和逐层蒸馏的CofiPruning算法。前者能够在不改变模型结构的基础上兼顾语言模型困惑度和检索速度方面的优势;而后者可以在保证下游任务准确度的同时实现更快的处理速度,具有更小的模型结构。陈丹琦 普
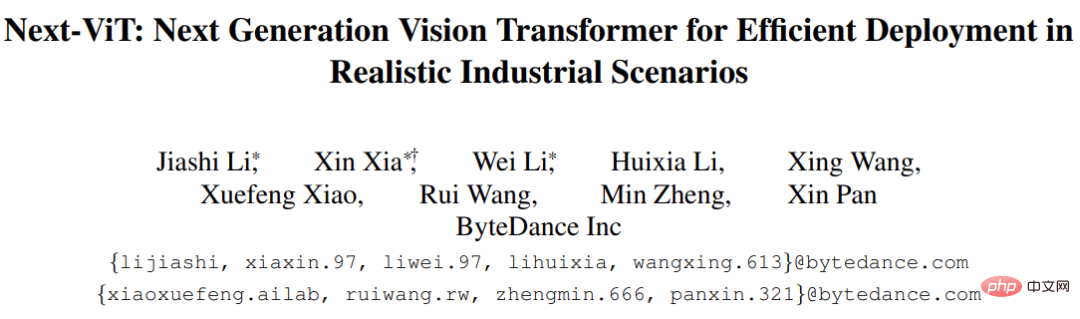 解锁CNN和Transformer正确结合方法,字节跳动提出有效的下一代视觉TransformerApr 09, 2023 pm 02:01 PM
由于复杂的注意力机制和模型设计,大多数现有的视觉 Transformer(ViT)在现实的工业部署场景中不能像卷积神经网络(CNN)那样高效地执行。这就带来了一个问题:视觉神经网络能否像 CNN 一样快速推断并像 ViT 一样强大?近期一些工作试图设计 CNN-Transformer 混合架构来解决这个问题,但这些工作的整体性能远不能令人满意。基于此,来自字节跳动的研究者提出了一种能在现实工业场景中有效部署的下一代视觉 Transformer——Next-ViT。从延迟 / 准确性权衡的角度看,
 Stable Diffusion XL 现已推出—有什么新功能,你知道吗?Apr 07, 2023 pm 11:21 PM
3月27号,Stability AI的创始人兼首席执行官Emad Mostaque在一条推文中宣布,Stable Diffusion XL 现已可用于公开测试。以下是一些事项:“XL”不是这个新的AI模型的官方名称。一旦发布稳定性AI公司的官方公告,名称将会更改。与先前版本相比,图像质量有所提高与先前版本相比,图像生成速度大大加快。示例图像让我们看看新旧AI模型在结果上的差异。Prompt: Luxury sports car with aerodynamic curves, shot in a
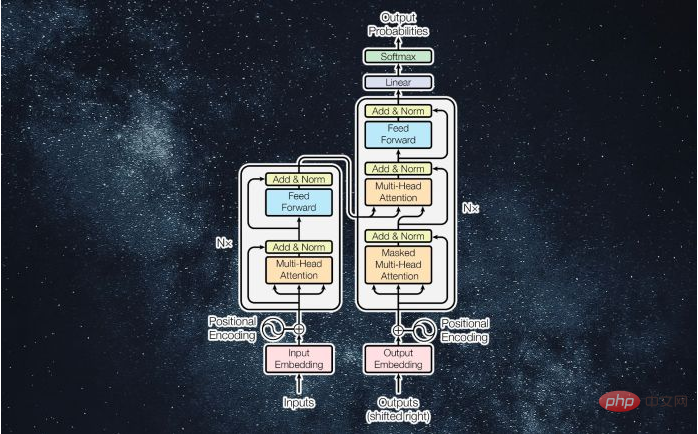 什么是Transformer机器学习模型?Apr 08, 2023 pm 06:31 PM
译者 | 李睿审校 | 孙淑娟近年来, Transformer 机器学习模型已经成为深度学习和深度神经网络技术进步的主要亮点之一。它主要用于自然语言处理中的高级应用。谷歌正在使用它来增强其搜索引擎结果。OpenAI 使用 Transformer 创建了著名的 GPT-2和 GPT-3模型。自从2017年首次亮相以来,Transformer 架构不断发展并扩展到多种不同的变体,从语言任务扩展到其他领域。它们已被用于时间序列预测。它们是 DeepMind 的蛋白质结构预测模型 AlphaFold
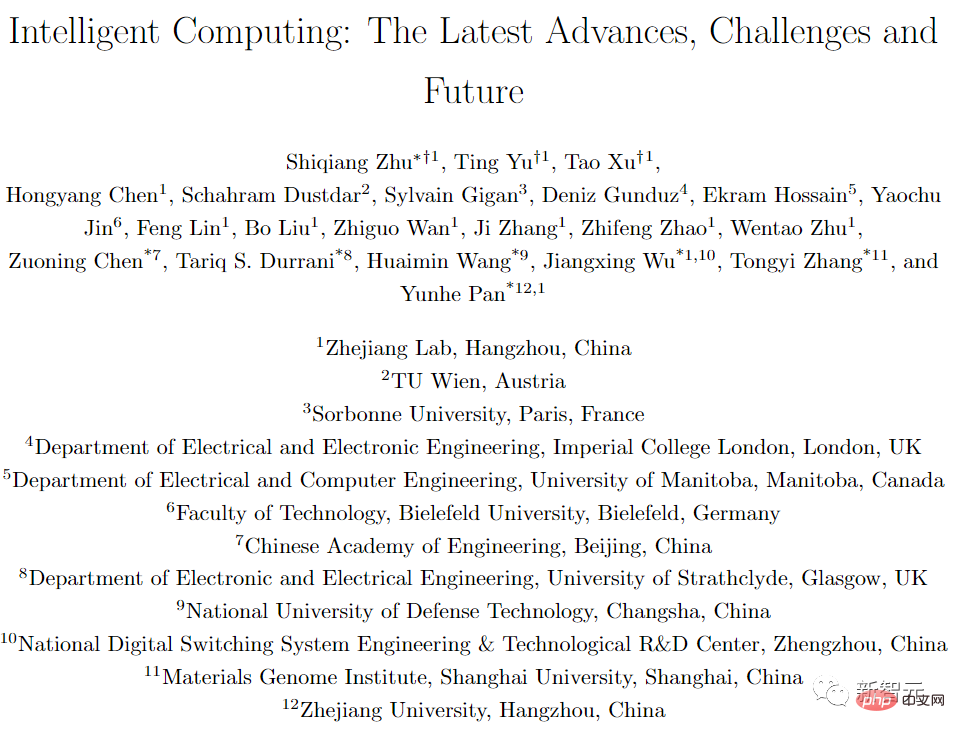 五年后AI所需算力超100万倍!十二家机构联合发表88页长文:「智能计算」是解药Apr 09, 2023 pm 07:01 PM
人工智能就是一个「拼财力」的行业,如果没有高性能计算设备,别说开发基础模型,就连微调模型都做不到。但如果只靠拼硬件,单靠当前计算性能的发展速度,迟早有一天无法满足日益膨胀的需求,所以还需要配套的软件来协调统筹计算能力,这时候就需要用到「智能计算」技术。最近,来自之江实验室、中国工程院、国防科技大学、浙江大学等多达十二个国内外研究机构共同发表了一篇论文,首次对智能计算领域进行了全面的调研,涵盖了理论基础、智能与计算的技术融合、重要应用、挑战和未来前景。论文链接:https://spj.scien
 AI模型告诉你,为啥巴西最可能在今年夺冠!曾精准预测前两届冠军Apr 09, 2023 pm 01:51 PM
说起2010年南非世界杯的最大网红,一定非「章鱼保罗」莫属!这只位于德国海洋生物中心的神奇章鱼,不仅成功预测了德国队全部七场比赛的结果,还顺利地选出了最终的总冠军西班牙队。不幸的是,保罗已经永远地离开了我们,但它的「遗产」却在人们预测足球比赛结果的尝试中持续存在。在艾伦图灵研究所(The Alan Turing Institute),随着2022年卡塔尔世界杯的持续进行,三位研究员Nick Barlow、Jack Roberts和Ryan Chan决定用一种AI算法预测今年的冠军归属。预测模型图


Hot AI Tools

Undresser.AI Undress
AI-powered app for creating realistic nude photos

AI Clothes Remover
Online AI tool for removing clothes from photos.

Undress AI Tool
Undress images for free

Clothoff.io
AI clothes remover

AI Hentai Generator
Generate AI Hentai for free.

Hot Article
Hot Tools

Dreamweaver CS6
Visual web development tools

WebStorm Mac version
Useful JavaScript development tools

Zend Studio 13.0.1
Powerful PHP integrated development environment

SAP NetWeaver Server Adapter for Eclipse
Integrate Eclipse with SAP NetWeaver application server.

Safe Exam Browser
Safe Exam Browser is a secure browser environment for taking online exams securely. This software turns any computer into a secure workstation. It controls access to any utility and prevents students from using unauthorized resources.

