
Home >Web Front-end >JS Tutorial >Why use debugger to debug code? This way you can read various source codes!
Why use debugger to debug code? This way you can read various source codes!

- 青灯夜游forward
- 2022-12-28 20:22:122408browse
Many students don’t know why they need to use debugger for debugging. Doesn’t console.log work? Also, I know how to use the debugger, but there is still a lot of code that I can’t understand. How to debug complex source code? This article will talk about why we should use these debugging tools. I hope it will be helpful to everyone!
console.log vs Debugger
I believe that most students use console.log for debugging and print the variable values they want to see on the console. [Recommended related tutorials: nodejs video tutorial, Programming teaching]
This can meet the needs, but it will not work when it comes to printing objects.
For example, if I want to see the value of the compilation object in the webpack source code, I print it:
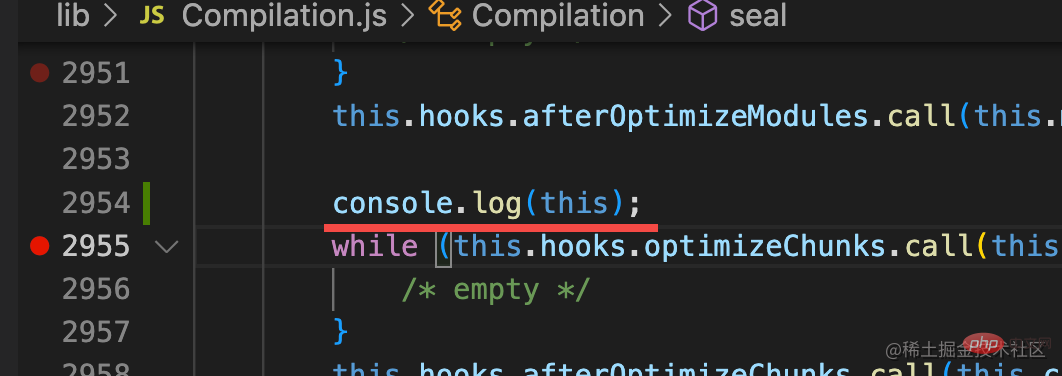
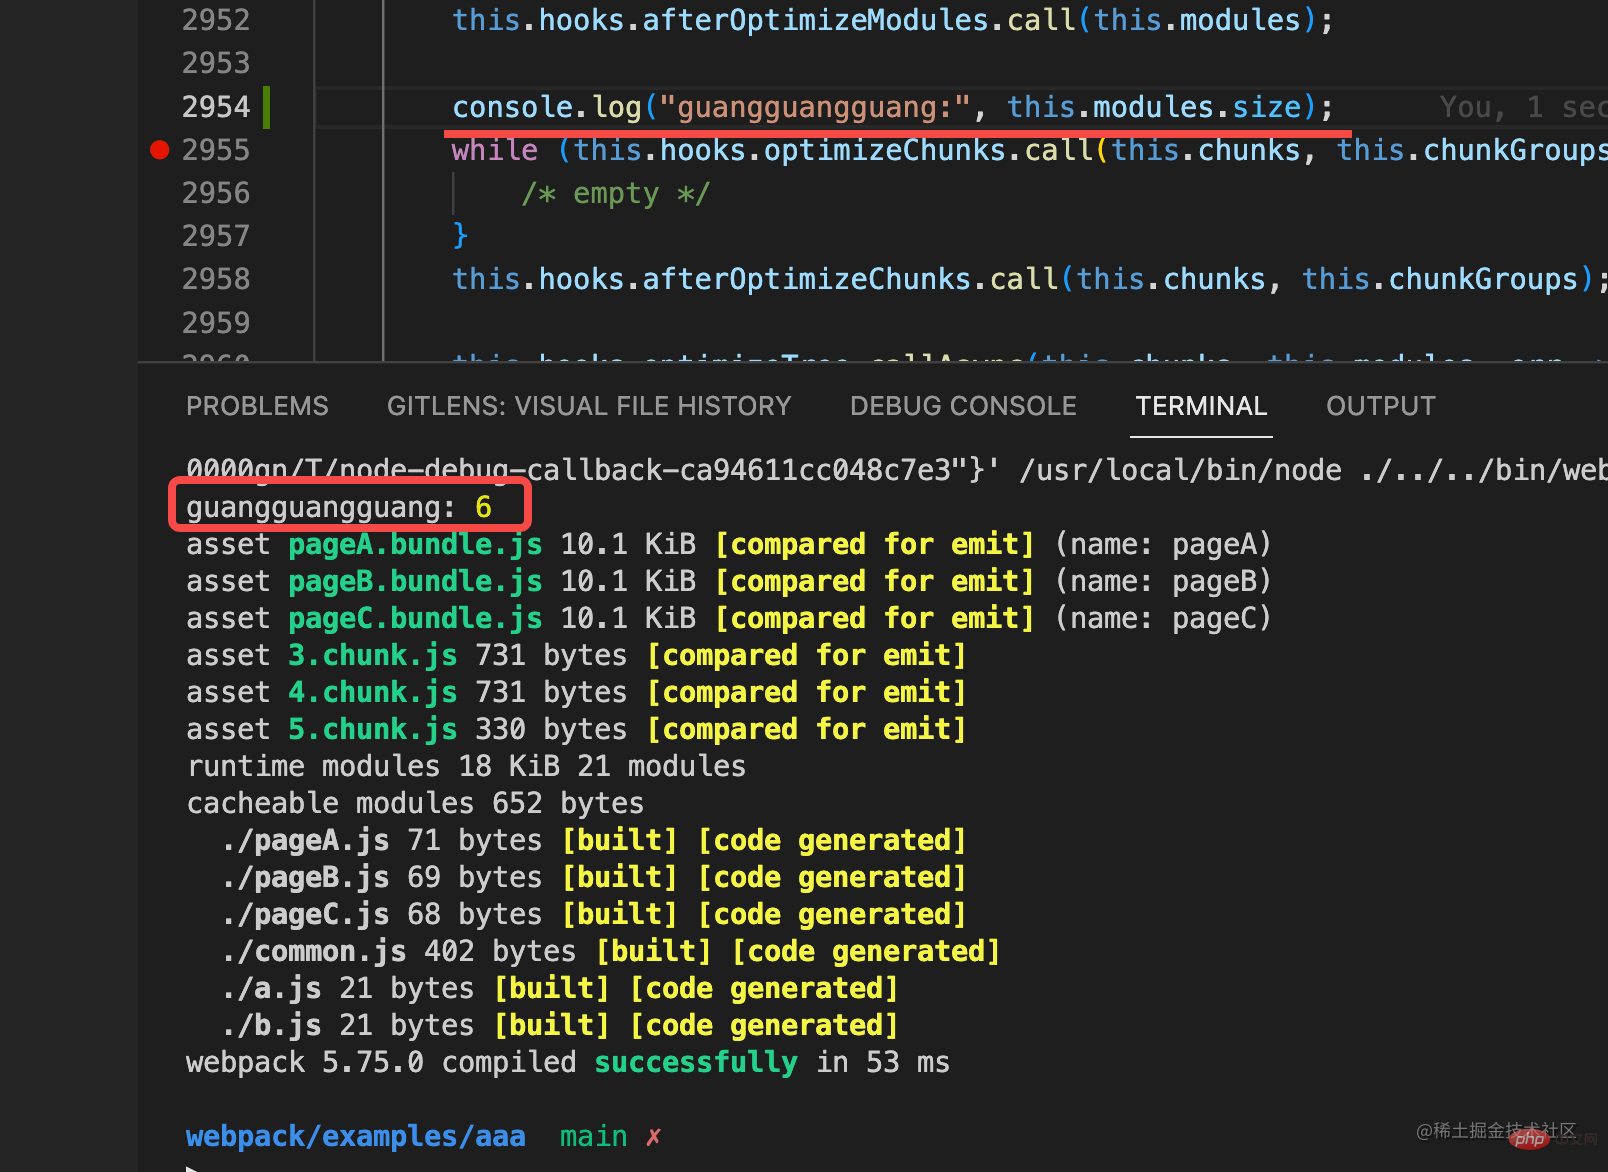
But you will find that the value of the object is also an object. It will not expand, but prints a [Object] [Array] string.
What’s more fatal is that printing too long will exceed the buffer size, and the terminal will display incomplete:
And if you use debugger to run, in Make a breakpoint here to see that these problems will disappear:
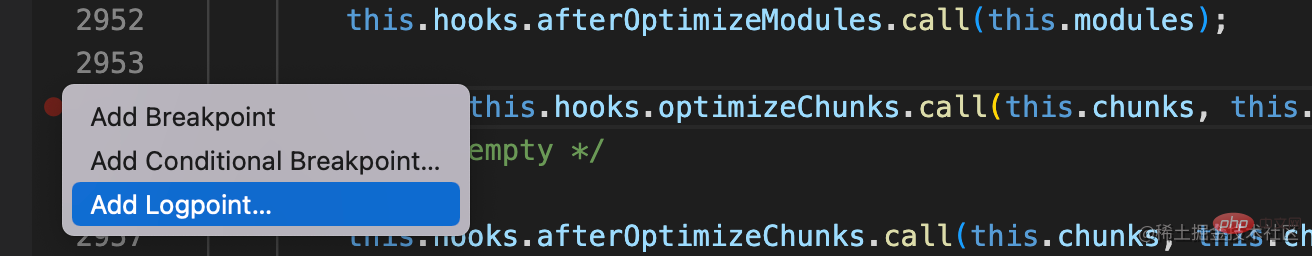
#Some students may say that it is still very convenient to use console.log when printing a simple value. ah.
For example:
Really?
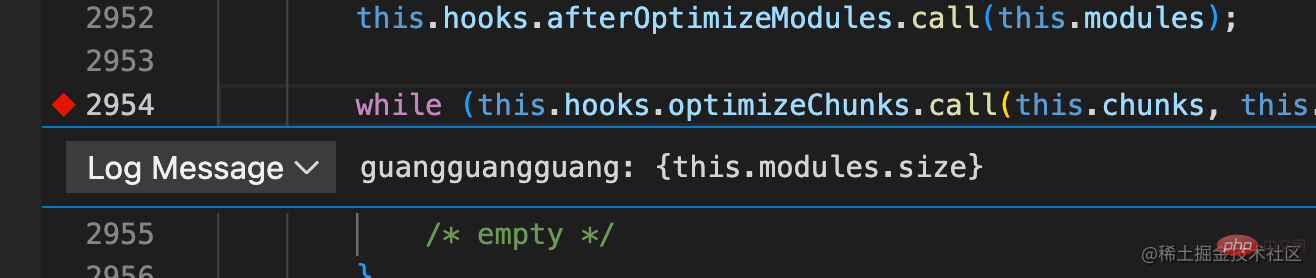
Then it is better to use logpoint:

Performance
As mentioned earlier, Debugger can see the execution path of a code, but the execution path of the code is often tortuous. For example, React will process each fiber node, and each node will call beginWork. After processing, the next node will be processed and beginWork will be called again: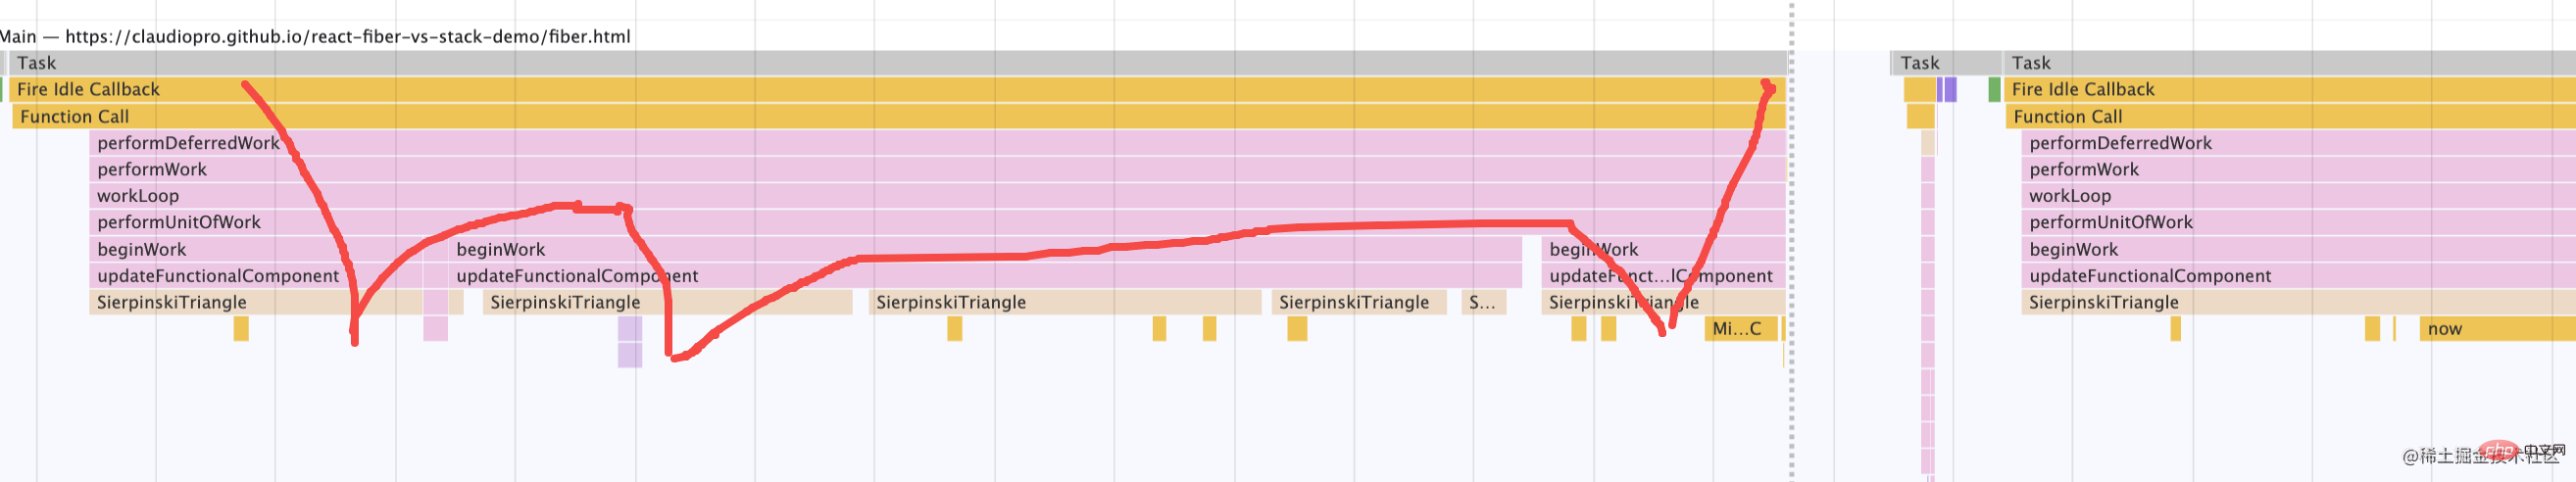
Just like you took a small road, then returned to the main road and took another small road. Using Debugger, you can only see the execution path of the current small road and not other The path of the small road:
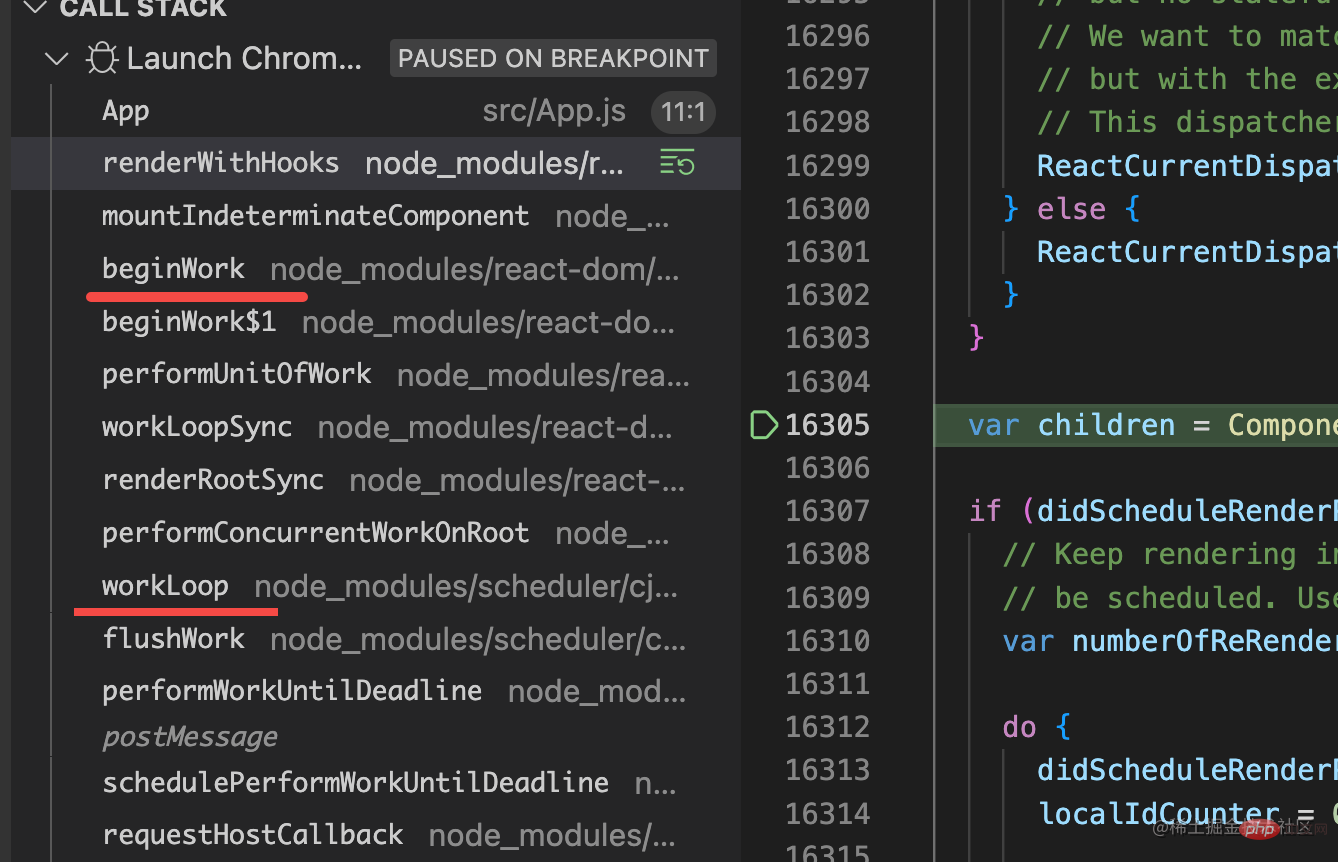
At this time, you can combine it with the Performance tool. Use the Performance tool to see the full picture of the code execution, and then use the Debugger to delve into the details of each code execution path. .
SourceMap
sourcemap is very important, because what we have executed is compiled and packaged code, which is basically unreadable , there is no point in debugging this kind of code, and sourcemap allows us to debug the original source code directly.
For example, vue, after associating the sourcemap, we can directly debug the ts source code:
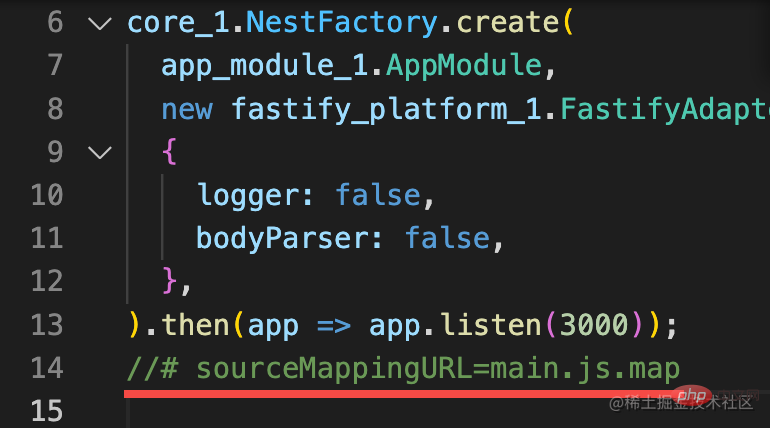
nest.js is also:
If you don’t use sourcemap, you want to understand the source code, but what you are debugging is the compiled code. How can you understand it?
Read a line
The Debugger, Performance, and SourceMap mentioned earlier are just tools for debugging code. What should I do if I know the debugging tools but still can’t read the code?
I think this is impossible.
Why do you say that?
Take the react source code as an example:
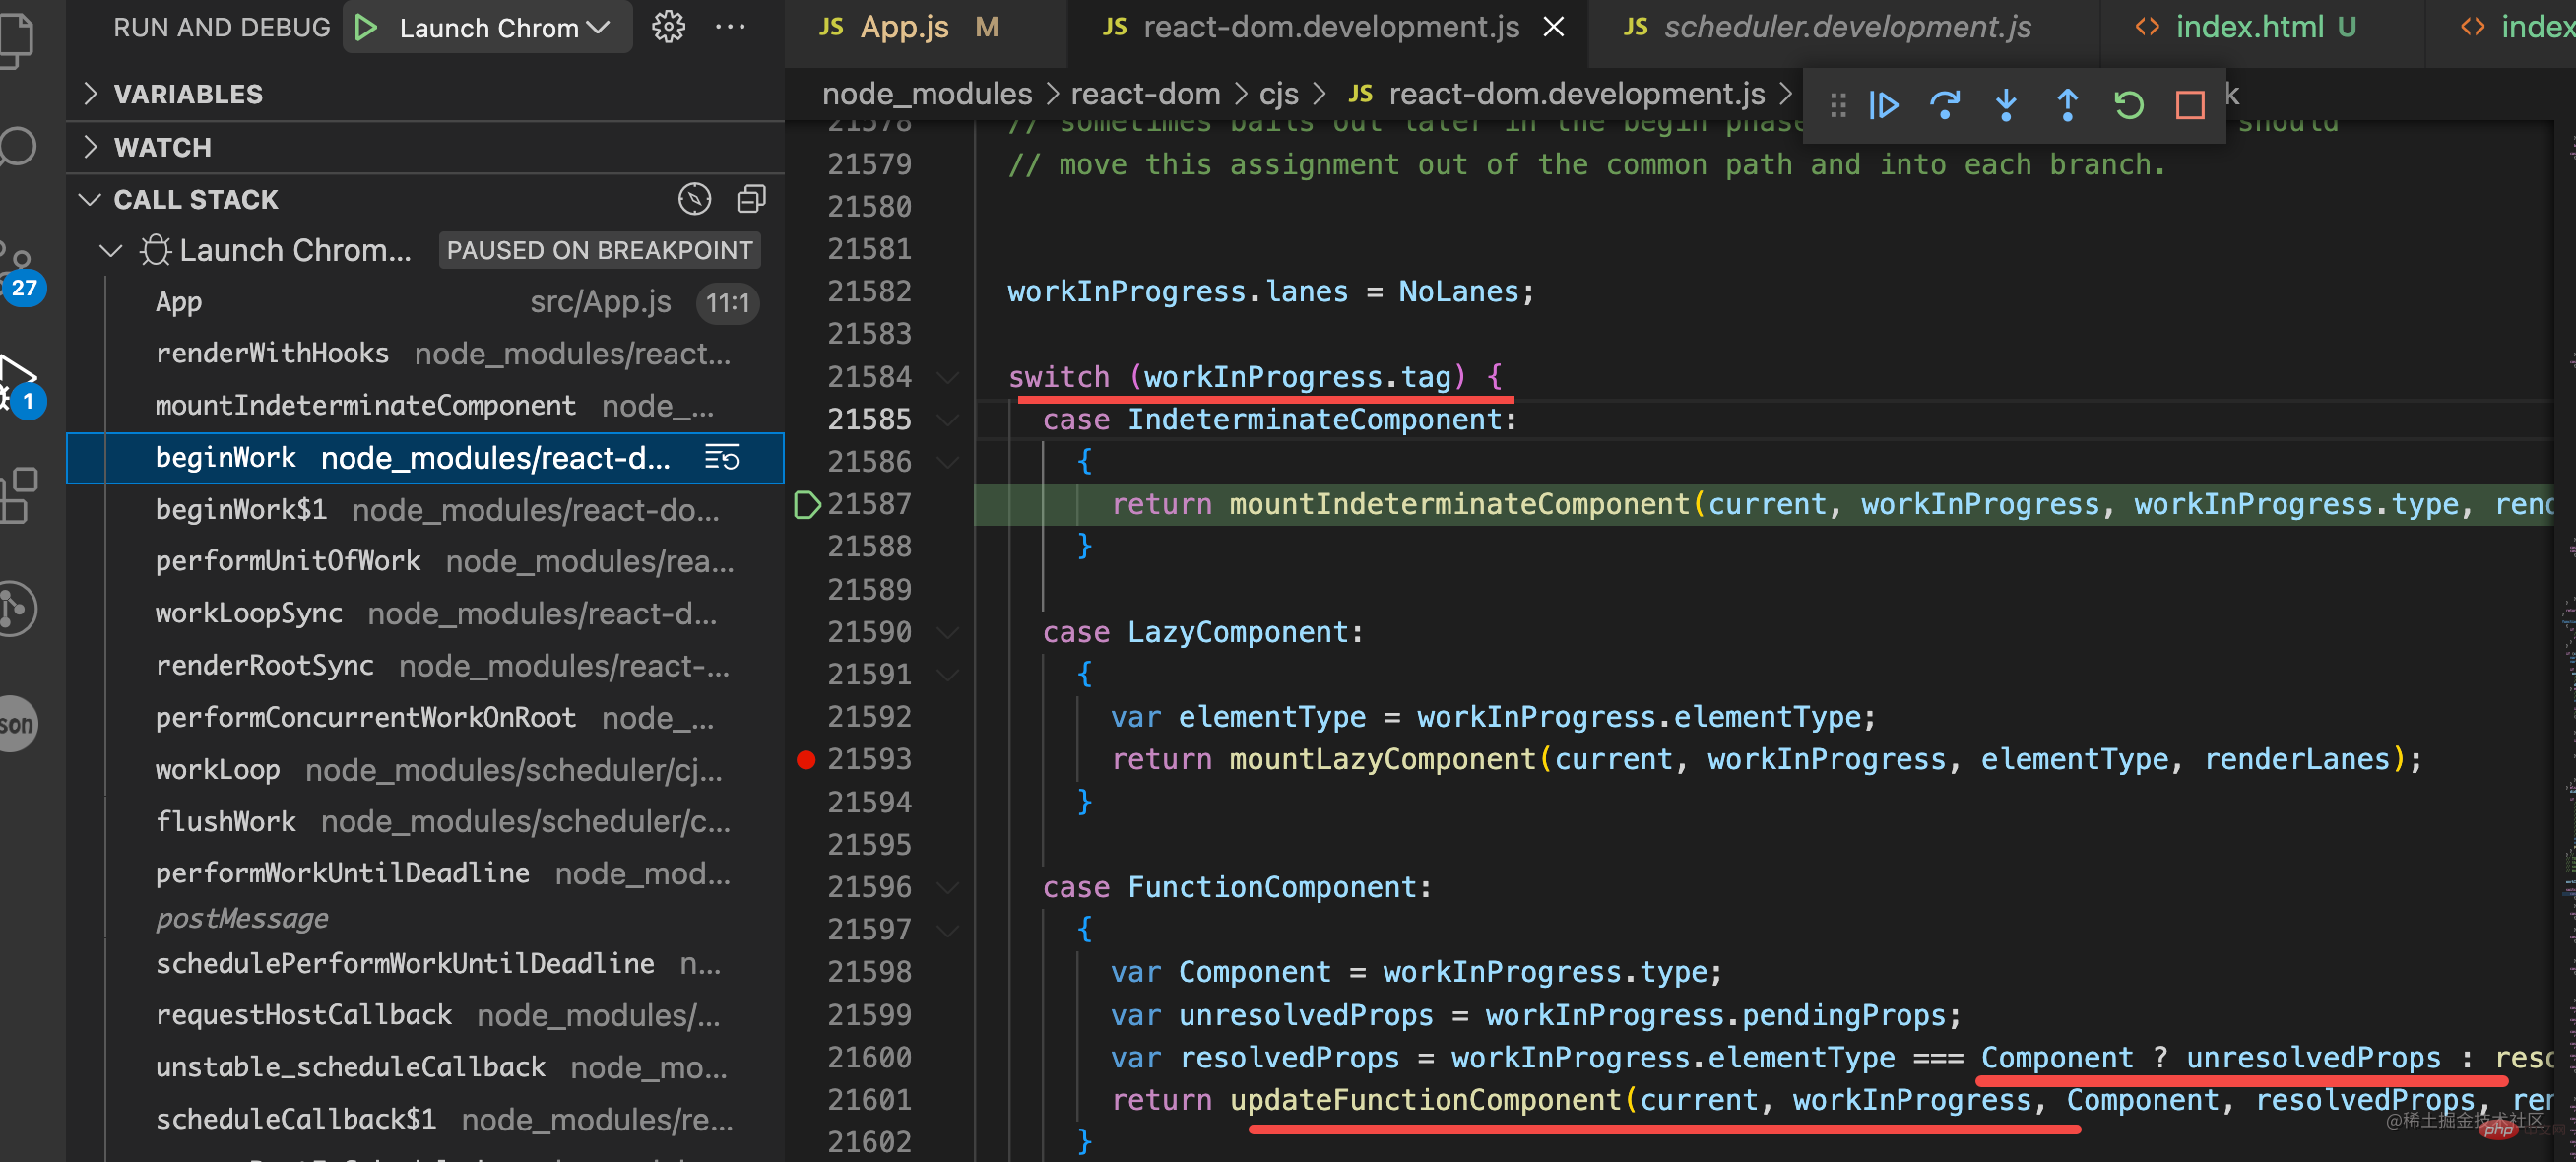
Can you understand the switch case? Can you understand the ternary operator? Can you understand the function call?
Every line of code can be read, and isn’t the entire code composed of this line of code?
Plus we can step through to know the code execution path.
Why can I understand each line of code, but cannot read them all together?
It should be that there is too much code and you don’t spend enough time.
First you need to understand one line, one function, and the implementation process of a small function. Gradually accumulate, and then the more you understand, the more code you can understand.
Summary
This article talks about why you should use debugging tools and how to understand complex code.
console.log has too many disadvantages. Large objects cannot be printed completely, the terminal buffer will be exceeded, object attributes cannot be expanded, etc. It is not recommended for everyone to use it. Even if you want to print, you can use LogPoint.
Using Debugger, you can see the call stack, which is the execution path of the code, the scope of each stack frame, and you can know what the code has experienced from the beginning to the present, while console.log can only know a certain the value of a variable.
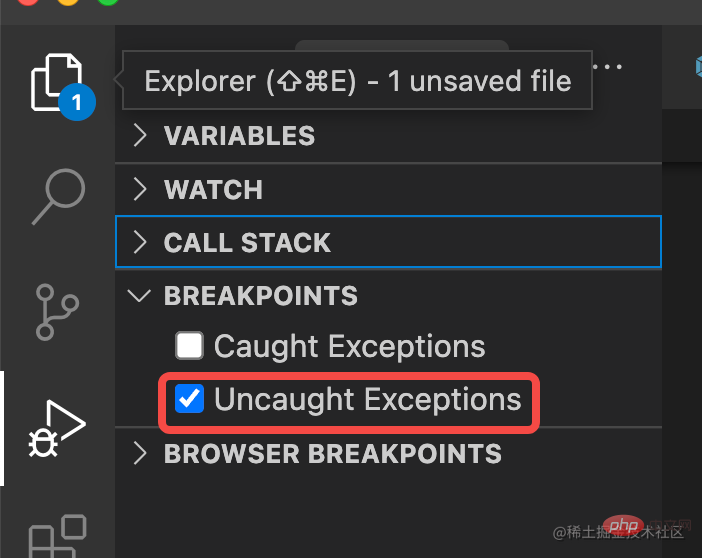
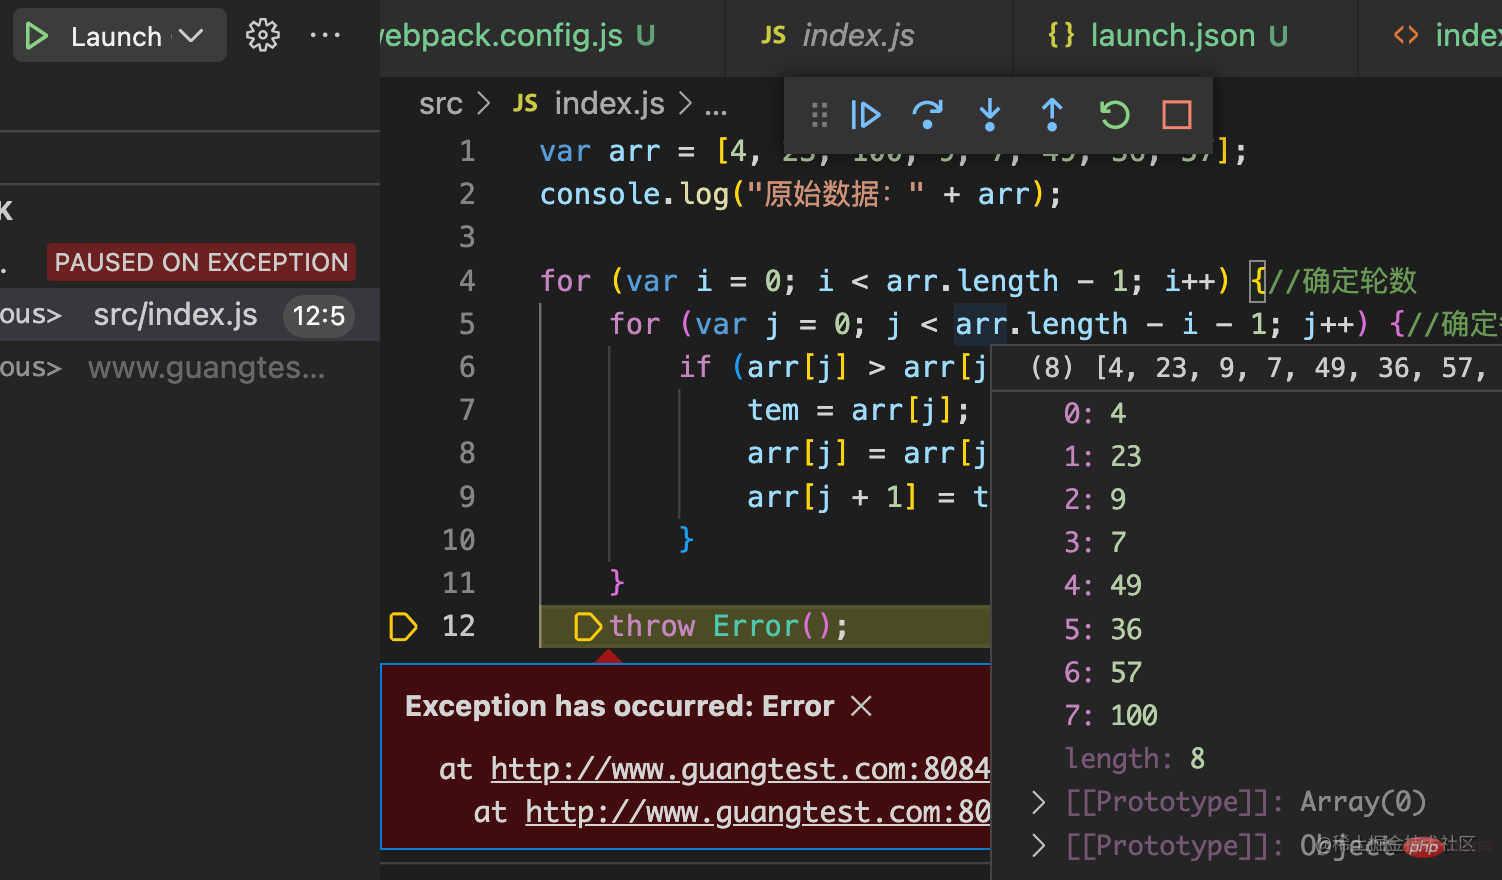
In addition, when reporting an error, you can also use exception breakpoints to sort out the code execution path to troubleshoot the cause of the error.
But Debugger can only see one execution path. You can use Performance to record the entire process of code execution, and then use Debugger to delve into the execution details of one of the paths.
In addition, it only makes sense to debug the original source code, otherwise debugging the compiled code will have a lot less information. You can use SourceMap to connect to the source code, whether it is the source code of Vue, React or the source code of Nest.js, Babel, etc.
After you learn how to debug, you can debug various codes. There is no incomprehensible source code, because every line of code is basic syntax and can be understood. If you can't understand it, just It may be that there is too much code, and you need more patience to read line by line of code, function by function, clarify the implementation of each function, and just accumulate slowly.
After mastering debugging codes based on Debugger, Performance, SourceMap, etc., various web pages and Node.js codes can be debugged, and various source codes can be read and understood! [Recommended learning: javascript video tutorial]
The above is the detailed content of Why use debugger to debug code? This way you can read various source codes!. For more information, please follow other related articles on the PHP Chinese website!