

 Web Front-endJS TutorialWhy do you need performance monitoring? Let's talk about Node.js performance monitoring
Why is performance monitoring needed? This article will take you through Node.js performance monitoring. I hope it will be helpful to you!

Why performance monitoring is needed
NodeAs a runtime (Runtime) of Javascript on the server side, It greatly enriches the application scenarios of Javascript.
But Node.js Runtime itself is a black box. We cannot perceive the status of the runtime, and it is difficult to reproduce online problems.
Therefore Performance monitoring is the cornerstone of the "normal operation" of Node.js applications. Not only can various runtime indicators be monitored at any time, but it can also help troubleshoot abnormal scenario problems.
Components
Performance monitoring can be divided into two parts:
-
Collection and display of performance indicators
- Process-level data: CPU, Memory, Heap, GC, etc.
- System-level data: disk occupancy, I/O load, TCP/UDP connection status, etc.
- Application layer data: QPS, slow HTTP, business processing link logs, etc.
-
Capture and analysis of performance data
- Heapsnapshot: Heap memory snapshot
- Cpuprofile: CPU snapshot
- Coredump: Application crash snapshot
Scheme comparison

From the above figure you can see the advantages and disadvantages of the three current mainstream Node.js performance monitoring solutions. The following is a brief introduction to the composition of these three solutions:
-
Prometheus
- prom-client is the nodejs implementation of prometheus, used to collect performance indicators
- grafana is A visualization platform used to display various data charts and support access to prometheus
- Only supports the collection and display of performance indicators. Other snapshot tools are needed to troubleshoot problems to form a closed loop
-
AliNode
-
alinode is an extended runtime compatible with official nodejs, providing some additional features:
- v8 Runtime memory status monitoring
- libuv's runtime status monitoring
- Online fault diagnosis functions: heap snapshot, CPU Profile, GC Trace, etc.
-
agenthub is a resident process used to collect performance indicators and report
The whole system forms a closed loop from monitoring, display, snapshot, and analysis. The access is convenient and simple, but there are still risks in expanding the runtime
-
Performance Indicators
CPU
process.cpuUsage() you can obtain the CPU consumption data of the current process. The unit of the return value is microseconds
- user: the CPU consumed by the process itself during execution Time
- system: The CPU time consumed by the system when the process is executed
Memory
##Pass
You can get the memory allocation data of the current process. The unit of the return value is bytes
- heapTotal: The heap memory size applied for by v8
- heapUsed: The heap memory size used by v8
- external: The memory size occupied by C managed by v8
- arrayBuffers: Memory size allocated to ArrayBuffer
#
As can be seen from the above figure, rss includes code segment (Code Segment), stack memory (Stack), and heap memory (Heap )
- Code Segment: stores code segments
- Stack: stores local variables and management function calls
- Heap: stores objects, closures, or others Everything
Heap
can be obtained from v8 through v8.getHeapStatistics() and v8.getHeapSpaceStatistics() Analysis data of heap memory and heap space. The following figure shows the distribution of heap memory composition of v8:
The heap memory space is first divided into spaces, and the space is divided into Page, memory is paged according to 1MB alignment.
-
New Space: New generation space, used to store some object data with a relatively short life cycle, divided into two spaces (space type is
semi space):from space,to space- Promotion conditions: Still surviving after two GCs in New space
Old Space: Old generation space, used to store
New SpacePromoted objectsCode Space: Store v8 JIT compiled executable code
Map Space: Stores the pointer object of the hidden class pointed to by Object. The hidden class pointer is the object layout structure recorded by v8 at runtime and is used to quickly access object members
Large Object Space: used to store objects larger than 1MB that cannot be allocated to pages
GC
v8 Garbage collection algorithms are divided into two categories:
- Major GC: uses the
Mark-Sweep-Compactalgorithm for object recycling in the old generation - Minor GC : Uses the
Scavengealgorithm for object recycling in the new generation
Scavenge
Premise: New space is divided into two object spaces: from and to
Trigger timing: when New space space Full
Steps:
In
from space, perform a breadth-first traversal-
Discover The surviving (reachable) object
- has survived once (experienced a Scavange) and was promoted to
Old space - Others are copied to
to space中
- has survived once (experienced a Scavange) and was promoted to
When the copy ends, there are only surviving objects in
to space, andfrom spaceis cleared.- ##Exchange
from space
andto space, and start the next roundScavenge
Suitable for objects with frequent recycling and small memory. It is a typical space-for-time strategy. The disadvantage is that twice as much space is wasted
Mark- Sweep-Compact

Old space is full
- Marking (three-color marking method)
- White: represents recyclable objects
- Black : Represents a non-recyclable object, and all the references generated by it have been scanned
- Gray: Represents a non-recyclable object, and the references generated by it have not been scanned
- Directly place the V8 root object The referenced objects are put into a
- marking queue
(explicit stack), and these objects are marked grayStart from these objects and do a depth-first traversal. Each time an object is accessed, the The object comes out of the - marking queue
and is marked black Then all white objects under the object reference are marked gray, - push
Go tomarking queue, and repeat until all objects on the stack are popped. There are only two types of objects in the old generation: black (non-recyclable) and white (can be recycled). - PS: When an object is too large to be pushed to the stack with limited space, v8 will keep the object in gray and skip it, marking the entire stack as overflowed. After the stack is cleared, it will be pushed again Traverse the mark, which will require an additional scan of the heap
- Sweep
- Clearing the white objects
- will cause the memory space to be insufficient Continuous
- Compact
- Since Sweep will cause the memory space to be discontinuous, it is not conducive for new objects to enter the GC
- Move the black (survival) object to one end of the
Old space, so that it can be cleared out The space is continuous and complete - Although it can solve the problem of memory fragmentation, it will increase the pause time (slow execution speed)
- It is only used when there is insufficient space to allocate objects promoted from the new generation. mark-compact
##Stop-The-World
When v8 initially performs garbage collection, you need to stop the running of the program. The program will not be re-run until the entire heap is scanned and the memory is reclaimed. This behavior is called full stop (Stop-The-World)
Optimization strategy
- Incremental Marking: In the Marking phase, when the heap reaches a certain size, incremental GC starts, each allocation After a certain amount of memory is obtained, the program is paused, marking is done for a few milliseconds to tens of milliseconds, and then the program is resumed.
- Concurrent Sweeping (Concurrent Sweeping): Let other threads do sweeping at the same time without worrying about conflict with the main thread of the executing program
- Parallel Sweeping (Parallel Sweeping): Let multiple Sweeping threads work at the same time, improving the throughput of sweeping and shortening the entire GC cycle
Space adjustment
Due to the default space limitations of v8 for the new and old generations The size is- New space
Default limit: 32M for 64-bit system, 16M for 32-bit system - Old space
Default limit: The 64-bit system is 1400M, and the 32-bit system is 700M
node provides two parameters for adjusting the upper limit of the space of the new and old generations
- --max-semi-space-size
: Set the maximum value ofNew Space - --max-old-space-size
: Set the maximum value ofOld Space
View GC log
node is also provided Three ways to view GC logs:
- --trace_gc
: One line of log briefly describes the time, type, heap size changes and causes of each GC - --trace_gc_verbose
: Display the detailed status of each V8 heap space after each GC - --trace_gc_nvp
: Detailed key-value pair information of each GC , including GC type, pause time, memory changes, etc.
v8-gc-log-parser## developed by the AliNode team.
#Snapshot ToolHeapsnapshot
Performs snapshot sampling of the
heap memoryof the running program, Can be used to analyze memory consumption and changes
Generation methodThere are several ways to generate the
.heapsnapshot file:

- Use the api provided by the nodejs built-in v8 module
-
- v8.getHeapSnapshot()

- ##v8.writeHeapSnapshot(fileName)
v8-profiler-next##Use - v8.getHeapSnapshot()
Analysis method
The generated .heapsnapshot file can be uploaded in Memory on the Chrome devtools toolbar and selected , the display result is as follows:
The default view is the Summary view. Here we want to focus on the two rightmost columns: Shallow Size and Retained Size
-
Shallow Size: Indicates the size of the object itself allocated in v8 heap memory -
Retained Size: Indicates theShallow Size# of all referenced objects of the object ##sum
Retained Size is found to be particularly large, there may be a memory leak inside the object, and you can further expand to locate the problem
ComparisonThe view is used to compare and analyze heap snapshots of two different periods. The Delta column can be used to filter out the objects with the largest memory changes
Cpuprofile
Snapshot sampling of theCPU of the running program can be used to analyze the CPU time consumption and proportion
Generation method
There are several ways to generate.cpuprofile files:
- v8-profiler (officially provided by node Tool, but it can no longer support node v10 or above and is no longer maintained)
- v8-profiler-next (Chinese maintenance version, supports the latest node v18, under continuous maintenance)
Analysis method
Generated.cpuprofile file can be displayed in Javascript Profiler of the Chrome devtools toolbar (not in the default tab, you need to open it in More on the right side of the toolbar). After selecting the upload file, the results will be displayed. As shown below:
Heavy view. Here we see two columns: Self Time and Total Time
- Self Time
: Represents the execution time of this function itself (excluding other calls) - Total Time
: Represents the total execution time of this function (including other calling functions)
Total Time and Self Time is found to be large , this function may be time-consuming and CPU-intensive calculations, you can also conduct further troubleshooting
Codedump
When the application unexpectedly crashes and terminates, the system will automatically Record the memory allocation information, Program Counter and stack pointer and other key information at the moment the process crashes to generate the core fileGeneration method
Generate.core Three methods for files:
- ulimit -c unlimited
Open kernel limit - node --abort-on-uncaught-exception
Add this parameter when node starts, you can generate a core file when an uncaught exception occurs in the application - gcore
Manually generate the core file
Analysis method
After obtaining the.core file, you can use mdb, gdb, lldb and other tools to analyze and diagnose the cause of the actual process crash
- llnode `which node` -c /path/to/core/dump
Case analysis
Observation

Analysis

heapsnapshot, we can analyze and find out that there is a newThing object that has always maintained a relatively large memory
Troubleshooting

unused method is not called, newThingThe object is referenced from theThing, causing it to always exist in the execution context of replaceThing and has not been released. This is a typical case of memory leak caused by closure
Summary
Common memory leaks include the following situations:- Global variables
- Closure
- Timer
- Event listening
- Cache
So in In the above situations, you must carefully consider whether the object will be automatically recycled in the memory. If it will not be automatically recycled, you need to manually recycle it, such as manually setting the object to null and removing the timing. Device, unbinding event monitoring, etc.
Summary
So far, this article has given a detailed introduction to the entire Node.js performance monitoring system.
First of all, it introduces the problems solved by performance monitoring, its components and a comparison of the advantages and disadvantages of mainstream solutions.
Then, the two major performance indicators and snapshot tools are introduced in detail.
- The performance indicators mainly focus on CPU, memory, heap space, and GC indicators, and are introduced at the same time. Understand v8's GC strategy and GC optimization plan,
- The snapshot tools mainly include heap snapshot, CPU snapshot and Coredump when crashing
Finally, reproduce a simple from observation, analysis and troubleshooting memory leak cases, and summarizes common memory leak situations and solutions.
I hope this article can help everyone understand the entire Node.js performance monitoring system.
For more node-related knowledge, please visit: nodejs tutorial!
The above is the detailed content of Why do you need performance monitoring? Let's talk about Node.js performance monitoring. For more information, please follow other related articles on the PHP Chinese website!

 Vercel是什么?怎么部署Node服务?May 07, 2022 pm 09:34 PM
Vercel是什么?本篇文章带大家了解一下Vercel,并介绍一下在Vercel中部署 Node 服务的方法,希望对大家有所帮助!
 node.js gm是什么Jul 12, 2022 pm 06:28 PM
gm是基于node.js的图片处理插件,它封装了图片处理工具GraphicsMagick(GM)和ImageMagick(IM),可使用spawn的方式调用。gm插件不是node默认安装的,需执行“npm install gm -S”进行安装才可使用。
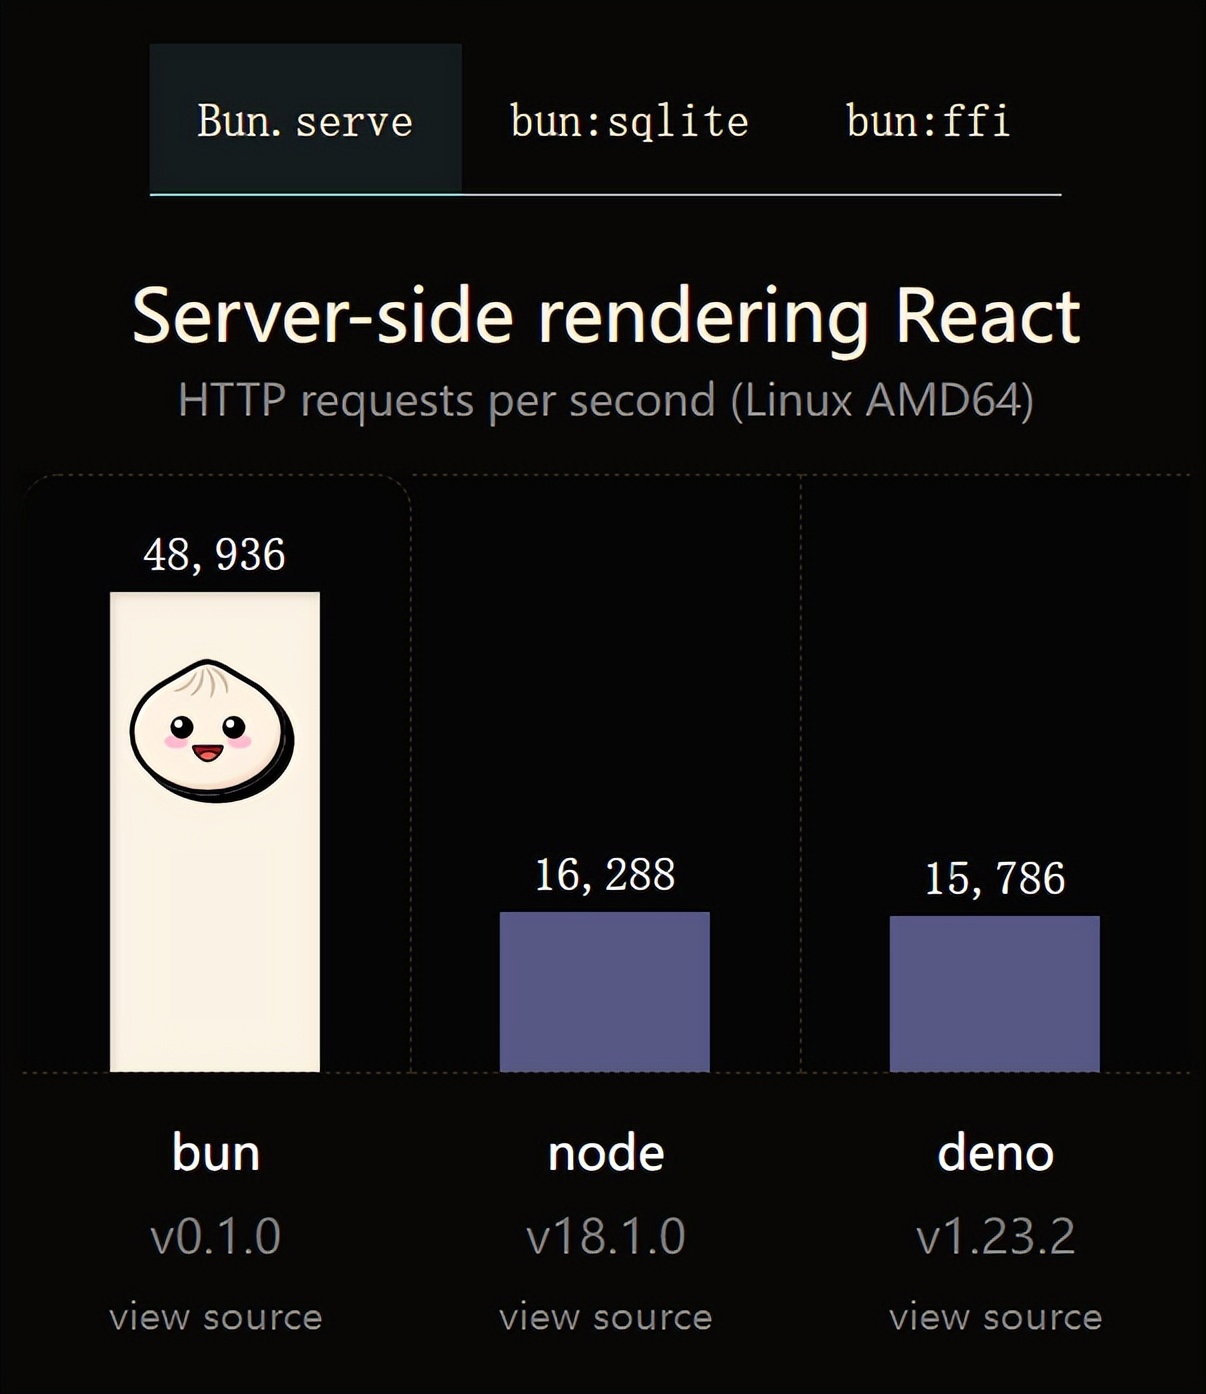 火了!新的JavaScript运行时:Bun,性能完爆NodeJul 15, 2022 pm 02:03 PM
今天跟大家介绍一个最新开源的 javaScript 运行时:Bun.js。比 Node.js 快三倍,新 JavaScript 运行时 Bun 火了!
 聊聊Node.js中的多进程和多线程Jul 25, 2022 pm 07:45 PM
大家都知道 Node.js 是单线程的,却不知它也提供了多进(线)程模块来加速处理一些特殊任务,本文便带领大家了解下 Node.js 的多进(线)程,希望对大家有所帮助!
 nodejs中lts是什么意思Jun 29, 2022 pm 03:30 PM
在nodejs中,lts是长期支持的意思,是“Long Time Support”的缩写;Node有奇数版本和偶数版本两条发布流程线,当一个奇数版本发布后,最近的一个偶数版本会立即进入LTS维护计划,一直持续18个月,在之后会有12个月的延长维护期,lts期间可以支持“bug fix”变更。
 node爬取数据实例:聊聊怎么抓取小说章节May 02, 2022 am 10:00 AM
node怎么爬取数据?下面本篇文章给大家分享一个node爬虫实例,聊聊利用node抓取小说章节的方法,希望对大家有所帮助!


Hot AI Tools

Undresser.AI Undress
AI-powered app for creating realistic nude photos

AI Clothes Remover
Online AI tool for removing clothes from photos.

Undress AI Tool
Undress images for free

Clothoff.io
AI clothes remover

AI Hentai Generator
Generate AI Hentai for free.

Hot Article
Hot Tools

PhpStorm Mac version
The latest (2018.2.1) professional PHP integrated development tool

SublimeText3 Mac version
God-level code editing software (SublimeText3)

mPDF
mPDF is a PHP library that can generate PDF files from UTF-8 encoded HTML. The original author, Ian Back, wrote mPDF to output PDF files "on the fly" from his website and handle different languages. It is slower than original scripts like HTML2FPDF and produces larger files when using Unicode fonts, but supports CSS styles etc. and has a lot of enhancements. Supports almost all languages, including RTL (Arabic and Hebrew) and CJK (Chinese, Japanese and Korean). Supports nested block-level elements (such as P, DIV),

Notepad++7.3.1
Easy-to-use and free code editor

Safe Exam Browser
Safe Exam Browser is a secure browser environment for taking online exams securely. This software turns any computer into a secure workstation. It controls access to any utility and prevents students from using unauthorized resources.

