Home >Web Front-end >JS Tutorial >Vomiting blood: JavaScript visualization library you deserve to know (Collection)
Vomiting blood: JavaScript visualization library you deserve to know (Collection)
- 青灯夜游forward
- 2022-02-22 10:21:373303browse
This article is a collection and sharing article of development tools (libraries). I would like to share with you the following JavaScript visualization libraries to improve development efficiency and make your projects more vivid and attractive. I hope it will be helpful to everyone!

Data Visualization Recommendation of data visualization tools
It is very feasible to build a company-level visualization library/tool from scratch within the R&D team Low (whether it is cost or ability, etc...), in summary, today I recommend some existing tools in the web direction (including implementation outlines, technical directions) for your reference.
All the following links are source code repositories.
Like and Collect No more worries about finding libraries for data visualization.
- d3 - JavaScript visualization library for HTML and SVG. [Related recommendations: javascript learning tutorial】

- ##metrics-graphics - is a library built on top of D3, optimized for the visualization and layout of time series data.


 ##raphael
##echarts - javascript provides a rich chart and visualization library.
sigma.js -
-
visjs - Multiple libraries for dynamic, browser-based data visualization. (The screenshot below is network)
two.js - A renderer-independent web two-dimensional drawing API.
-
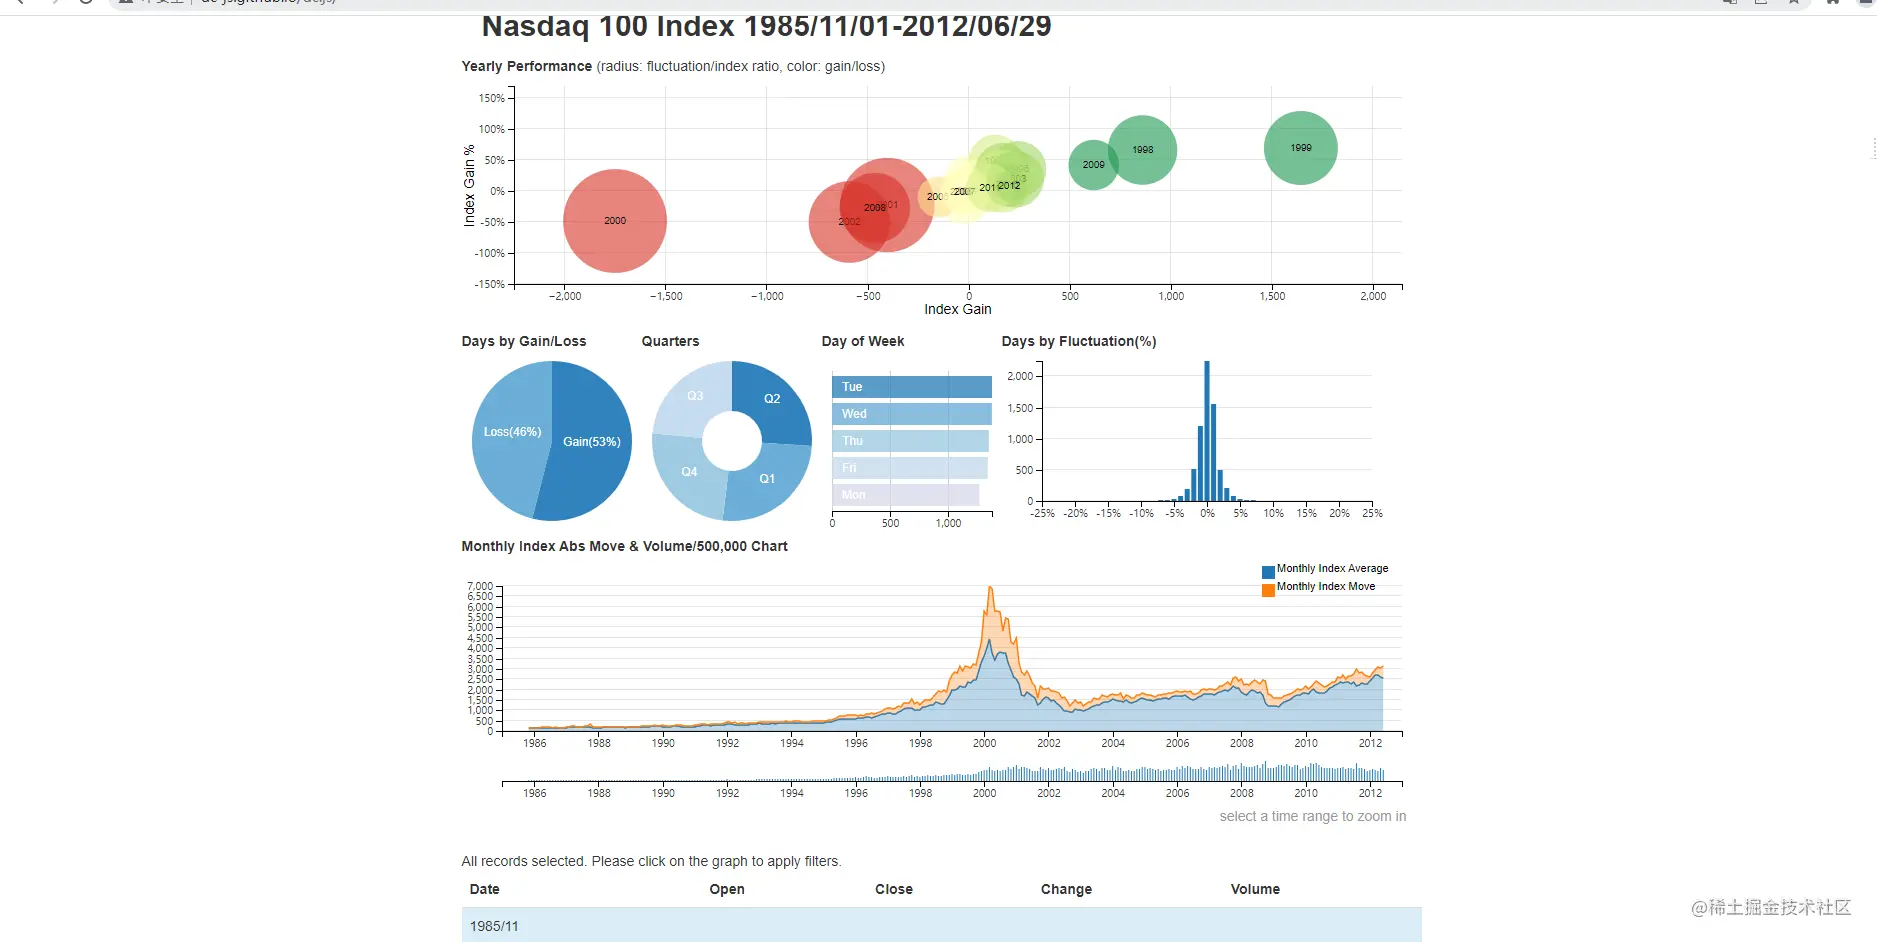
- dc.js - Multidimensional charts are js built for working natively with cross filters rendered by d3

- flot - JavaScript charts based on jQuery.
##dimple.js
chartist-js
- Universal real-time charting library.##epoch
- A reusable charting library based on D3.c3
- A framework for building 3D games with HTML5 and WebGL.BabylonJS
- Recharts library redefined using React and D3.recharts
GraphicsJS
- is a set of visualization underlying engines based on graphical grammar theory, oriented to conventional statistical charts ,Visual graph grammar.G2
##G2Plot
##Cytoscape.js- A simple, easy-to-use statistical chart library with certain expansion and combination capabilities
- A fully functional graph theory library.
- cola.js - library for arranging your HTML5 documents and diagrams using constraint-based optimization techniques
- jointjs - Charting library for creating static charts or fully interactive charting tools. (Includes free and/paid versions)
-------------------------------- ----Network problems without screenshots------------------------------------------ ---Frappe Charts - GitHub-inspired simple and modern SVG charts for the web with zero dependencies.
Frappe Gantt - A simple, interactive, modern gantt chart library for the web.
- ##heatmap.js
- jquery.sparkline
- A plugin for the jQuery JavaScript library for generating small mini charts directly in the browser.
- d3-cloud Some other paid products
webfrontendanychart:https://www.anychart.com/
plotly:https://plotly.com/
highchart, :https://www.highcharts.com/
lightning chart:https://www.arction.com/lightningchart-js/
【Related video tutorial recommendations:
The above is the detailed content of Vomiting blood: JavaScript visualization library you deserve to know (Collection). For more information, please follow other related articles on the PHP Chinese website!
Related articles
See more- What are the javascript operators?
- Detailed explanation and case introduction of Javascript decorator principle
- What are the commonly used events in javascript
- Does javascript have selectors?
- What is the function that javascript can use to implement warning boxes?
- How to implement division with two decimal places in javascript


)
)
)
)
)
)
)
)
)