Home >Development Tools >phpstorm >Detailed introduction to phpstorm debug tool yasd (super easy to use)
Detailed introduction to phpstorm debug tool yasd (super easy to use)
- WBOYWBOYWBOYWBOYWBOYWBOYWBOYWBOYWBOYWBOYWBOYWBOYWBforward
- 2022-01-17 15:33:155807browse
This article brings you the super easy-to-use phpstorm debug tool. Usually during development, someone may choose to install the xdebug extension and configure xdebug in phpstorm for debugging. I hope it will be helpful to everyone.

Normally in development, there will always be times when debugging is needed. Manual interruption methods such as var_dump and die are always time-consuming and labor-intensive and not elegant. At this time Some people may choose to install the xdebug extension and configure xdebug in phpstorm for debugging.
But when you need to use the swoole framework and need to debug the code in the swoole framework, xdebug cannot be used on swoole, and it conflicts with swoole.
Then I found a relatively easy-to-use debugging tool that is compatible with the fpm framework and the swoole framework, yasd.
##Installation
1. Install the boots library on Mac
brew install boost
2. Download the yasd source code from Github
git clone https://github.com/swoole/yasd.git
3. Compile and install yasd
cd yasd
phpize --clean && \
phpize && \
./configure && \
make clean && \
make && \
make install
4. Modify php.ini
zend_extension="yasd.so"
;命令行调试
;yasd.debug_mode=cmd
;远程调试
yasd.debug_mode=remote
;本地开发地址
yasd.remote_host=127.0.0.1
;本地开发监听端口
yasd.remote_port=9000
View extended information
➜  yasd php --ri yasd
yasd
Yasd => enabled
Author => codinghuang <codinghuang@qq.com>
Version => 0.3.9-alpha
Built => Jan 15 2022 14:09:47
Directive => Local Value => Master Value
yasd.breakpoints_file => no value => no value
yasd.debug_mode => remote => remote
yasd.remote_host => 127.0.0.1 => 127.0.0.1
yasd.remote_port => 9000 => 9000
yasd.depth => 1 => 1
yasd.log_level => -1 => -1
yasd.max_executed_opline_num => 0 => 0
yasd.init_file => no value => no value
yasd.open_extended_info => 0 => 0
xdebug.coverage_enable => 1 => 1
xdebug.profiler_enable => 1 => 1
xdebug.remote_autostart => 1 => 1
xdebug.remote_connect_back => 0 => 0
xdebug.remote_mode => req => req
xdebug.idekey => hantaohuang => hantaohuang
5. Debugging script
To use yasd to debug the script, you must add - e php parameters, for example,# 调试普通php脚本 php -e test.php # 调试 laravel 的 command php -e artisan test # 调试 hyperf 框架 php -e bin/hyperf start
Configure phpstorm
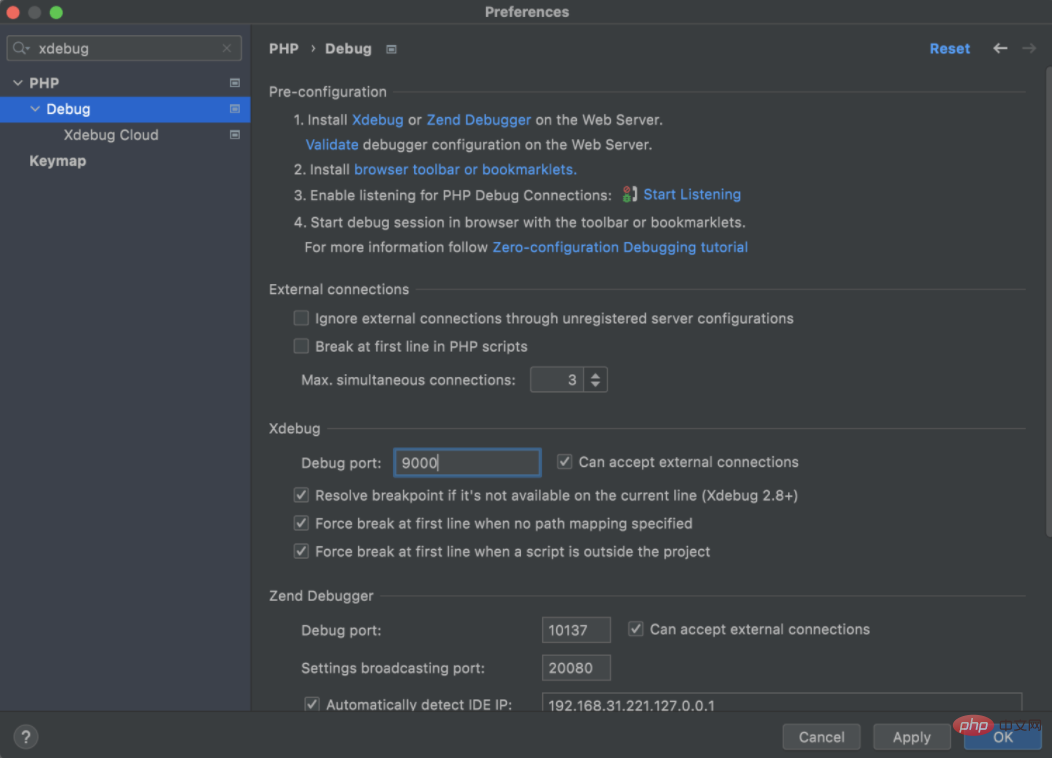
1. Configure phpstorm to listen to port 9000

2. Click the phone icon in the upper right corner of phpstorm to start monitoring

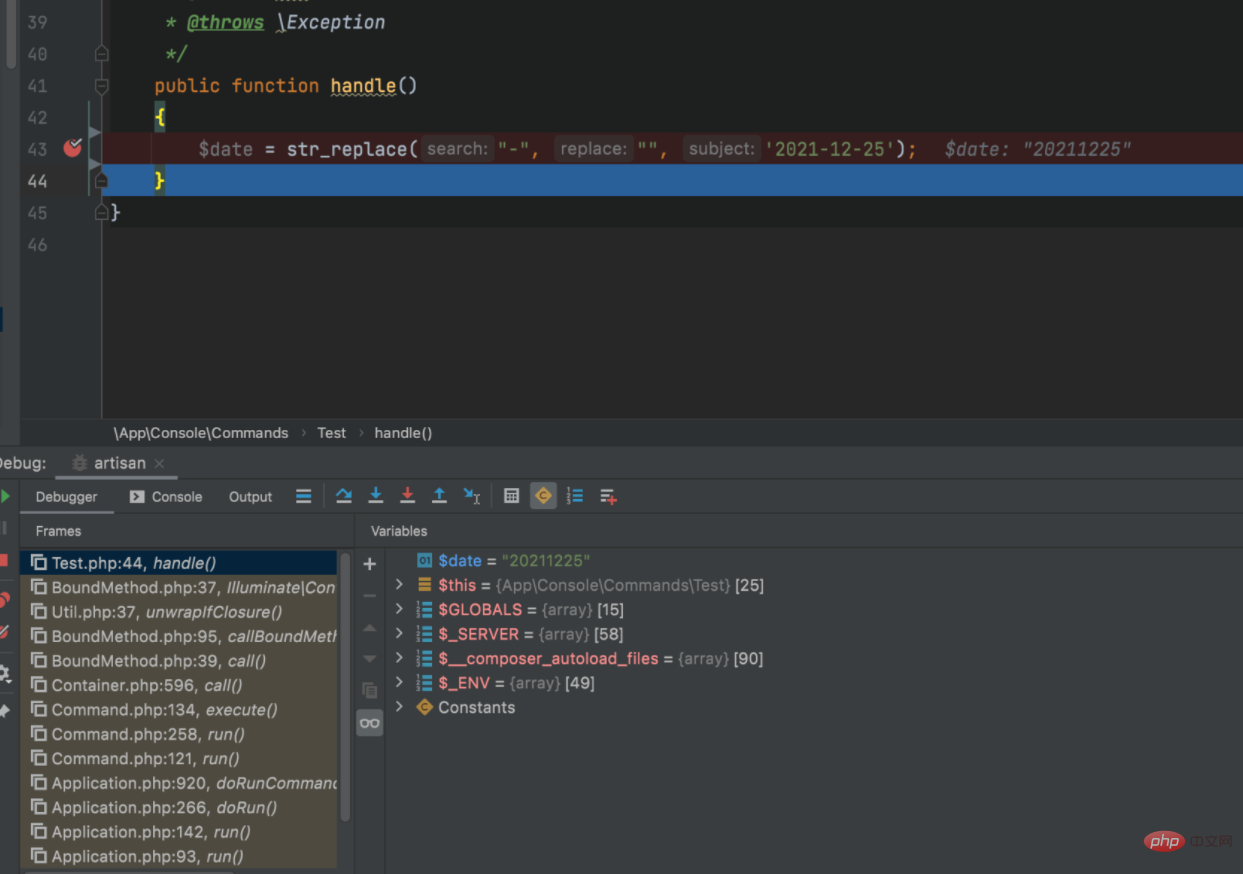
3. Test debug debugging
Write a test command in Laravelphp -e artisan test

Debugging the Hyperf framework
The above mentioned debugging in fpm, let’s talk about how to debug in the Hyperf frameworkSome points to note1. When using Hyperf, you need to set the scan_cacheable parameter in config.php to true. This parameter is whether to scan the proxy class. If set to true, the cache proxy class will be scanned directly every time it is started, instead of rescanning. Generating proxy class. After setting it to true, please note that each time you modify the code, you need to manually generate the proxy class, composer dump-autoload -o, and then start it. Or modify the code directly in the proxy class. When debugging is completed, copy the code in the proxy class to the real class. The proxy class generation path is in runtime/container/proxy2. If Swoole Server is used in the Hyperf framework, worker_num needs to be set to 1, otherwise the breakpoint may not take effect. This parameter is in server.php. The remaining debugging is no different from what was mentioned above. Recommended learning: "
phpstorm tutorial"
The above is the detailed content of Detailed introduction to phpstorm debug tool yasd (super easy to use). For more information, please follow other related articles on the PHP Chinese website!
Related articles
See more- Don't miss these two efficient plug-ins in phpstorm!
- What should I do if phpstorm cannot be opened after setting the memory limit?
- This phpstorm plug-in can automatically take variable names! (recommend)
- How to configure xdebug for debugging in Homestead (PhpStorm)
- PhpStorm 2021.3.1 is released, adding 'trusted projects'!

