Home >Backend Development >PHP Problem >What to do if there are too many php processes
What to do if there are too many php processes
- 藏色散人Original
- 2021-11-17 09:22:543753browse
Solutions to too many php processes: 1. Check the processes of the current system through the "ps -ef | wc -l" command; 2. Then use related commands to check the process that takes up the largest amount of memory; 3. Query php -fpm process; 4. Just kill the process or limit the memory size.

The operating environment of this article: linux5.9.8 system, PHP5.5 version, DELL G3 computer
php process is too What to do if there are too many?
The number of Linux server php-fpm processes is too many and the memory is full:
I found the server mysql when I arrived at work in the morning. The server stopped and then started up
Query log shows that the memory is full. Kill the mysql service. If the memory is full, the Linux server will automatically clean up the process to prevent the server from hanging. If you choose, whoever occupies the most memory will be killed first. My server has the mysql service. The memory is the largest, so I killed mysql

and then restarted mysql to query the memory

Say here Let’s take a look at the memory of Linux
For example
The following shows that free displays the current memory usage, and -m means M bytes to display the content. Let’s take a look.
$ free -m
total  used  free  shared  buffers  cached
Mem:  1002M  769M 232M  0M  62M  421M
-/+ buffers/cache:  286M  715M
Swap:  1153M  0M  1153M
---------------------------
真实内存占用 = used-buffers-cached = 286M
-----------------
The first part of the Mem line:
total 内存总数: 1002M
used 已经使用的内存数: 769M
free 空闲的内存数: 232M
shared 当前已经废弃不用,总是0
buffers Buffer 缓存内存数: 62M
cached Page 缓存内存数:421M
Relationship: total(1002M) = used(769M) free(232M)
Part 2 (-/buffers/cache):
(-buffers/cache) used内存数:286M (指的第一部分Mem行中的used - buffers - cached)
(+buffers/cache) free内存数: 715M (指的第一部分Mem行中的free + buffers + cached)
It can be seen that -buffers/cache reflects the memory actually eaten by the program. Buffers/cache reflects the total amount of memory that can be appropriated.
The third part refers to the swap partition. I think everyone understands it without explaining it.
I think everyone is still confused after reading the above .Why the results about used and free in the first part (Mem) and the second part (-/buffers/cache) are so strange.
In fact, we can explain it from two aspects.
For the operating system, Mem's parameters .buffers/cached are all used, so it thinks that free is only 232.
For the application, it is (-/buffers/cach).buffers/cached. Equally available, because buffer/cached is to improve the performance of program execution. When the program uses memory, buffer/cached will be used quickly.
So, let’s look at the application, mainly the free and used of (-/ buffers/cache). So let’s just look at this. In addition, I will tell you some common sense. Linux In order to improve the efficiency of disk and memory access, Linux has made a lot of elaborate designs. In addition to caching dentry (used in VFS to accelerate the conversion of file path names to inodes), it also adopts two main Cache methods: Buffer Cache and Page Cache. The former is for reading and writing disk blocks, and the latter is for reading and writing file inodes. These caches can effectively shorten the time of I/O system calls (such as read, write, getdents).
Remember that memory is for use, not for reading. Unlike Windows, no matter how much real physical memory you have, it must use the hard disk swap file to read. This is why Windows often prompts that there is insufficient virtual space. Think about it, how boring it is to use a part of the hard disk space as memory when there is still most of the memory. How can the hard disk be faster than the memory. So let's look at Linux, As long as you don't use swap space, you don't have to worry about having too little memory. If you often use a lot of swap, you may have to consider adding physical memory. This is also the standard for Linux to see if the memory is enough.
-------------------------------------------------- -------------------------------------------------- -----------------------
Next step
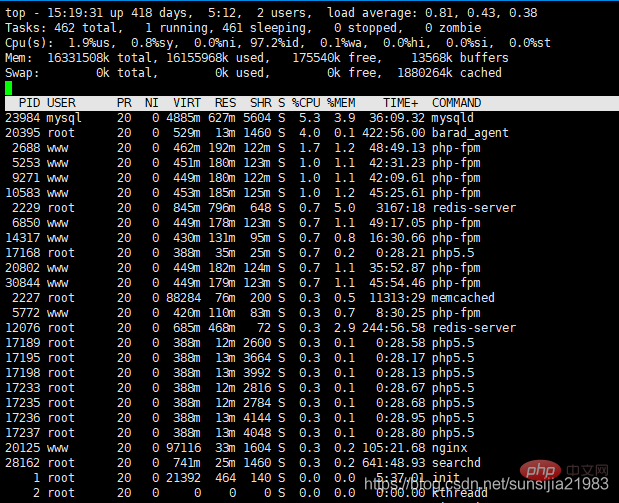
It is found that the server's memory is only 1.9G, then use the top command Check it out

The first line top is: current time; number of days the system has been running; number of users; average system load, and the following The three values are the average number of processes 1 minute ago, 5 minutes ago, and 15 minutes ago. When this value exceeds the number of CPUs, it indicates that the load is too high.
The tasks in the second line are: total number of processes; running processes number; number of sleeping processes; number of stopped processes; number of restored processes
The third line of CPU (s) are:
us: Percentage of cpu occupied by user user space
sy:system The percentage of CPU occupied by kernel space
ni:niced The percentage of CPU occupied by processes that have changed priority
The percentage of idle CPU
wa:IO wait The percentage of CPU occupied by IO waiting
hi: Hardware IRQ The percentage of CPU occupied by hard interrupts
si:software The percentage of CPU occupied by software interrupts
st: The time stolen by hypervisor
The fourth line of Mem is: total memory; used memory ;Free memory;Buffer memory in use
第五行(Swap):类似第四行,但反映着交换分区(Swap)的使用情况。交换分区(Swap)被频繁使用,可以看作物理内存不足而造成的
top 输出界面的顶端,也显示了系统整体的内存使用情况,这些数据跟 free 类似,我就不再重复解释。我们接着看下面的内容,跟内存相关的几列数据,比如 VIRT、RES、SHR 以及 %MEM 等。
这些数据,包含了进程最重要的几个内存使用情况,我们挨个来看。
- VIRT 是进程虚拟内存的大小,只要是进程申请过的内存,即便还没有真正分配物理内存,也会计算在内。
- RES 是常驻内存的大小,也就是进程实际使用的物理内存大小,但不包括 Swap 和共享内存。
- SHR 是共享内存的大小,比如与其他进程共同使用的共享内存、加载的动态链接库以及程序的代码段等。
- %MEM 是进程使用物理内存占系统总内存的百分比。
除了要认识这些基本信息,在查看 top 输出时,你还要注意两点。
第一,虚拟内存通常并不会全部分配物理内存。从上面的输出,你可以发现每个进程的虚拟内存都比常驻内存大得多。
第二,共享内存 SHR 并不一定是共享的,比方说,程序的代码段、非共享的动态链接库,也都算在 SHR 里。当然,SHR 也包括了进程间真正共享的内存。所以在计算多个进程的内存使用时,不要把所有进程的 SHR 直接相加得出结果。
只是这样看 还是不行 感觉内存 不应该 占用很多 然后 使用命令 查看 当前系统有多少进程
ps -ef | wc -l

然后使用命令查看占用内存最大的500个进程:
ps -aux | sort -k4nr | head -n 500
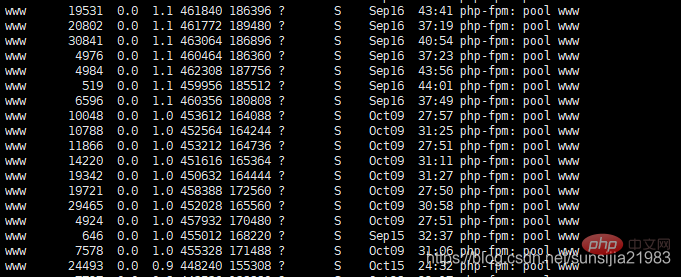
截取部分 PHP的进程 占到了200个 每个都100多兆


解释一下含义
USER: 行程拥有者
PID: pid
%CPU: 占用的 CPU 使用率
%MEM: 占用的记忆体使用率
VSZ: 占用的虚拟记忆体大小
RSS: 占用的记忆体大小
TTY: 终端的次要装置号码 (minor device number of tty)
STAT: 该行程的状态,linux的进程有5种状态:
D 无法中断的休眠状态(通常 IO 的进程);
R 正在运行可中在队列中可过行的;
S 处于休眠状态;
T 停止或被追踪;
W 进入内存交换  (从内核2.6开始无效);
X 死掉的进程   (基本很少見);
Z 僵尸进程;
< 优先级高的进程
N 优先级较低的进程
L 有些页被锁进内存;
s 进程的领导者(在它之下有子进程);
l 多进程的(使用 CLONE_THREAD, 类似 NPTL pthreads);
+ 位于后台的进程组;
注: 其它状态还包括W(无驻留页), <(高优先级进程), N(低优先级进程), L(内存锁页).
START: 行程开始时间
TIME: 执行的时间
COMMAND:所执行的指令
查询PHP-fpm 总进程数
pstree|grep php-fpm
然后 查询 php-fpm 进程
ps -ef|grep php-fpm
发现PHP起了四个主进程 这里截取了三个

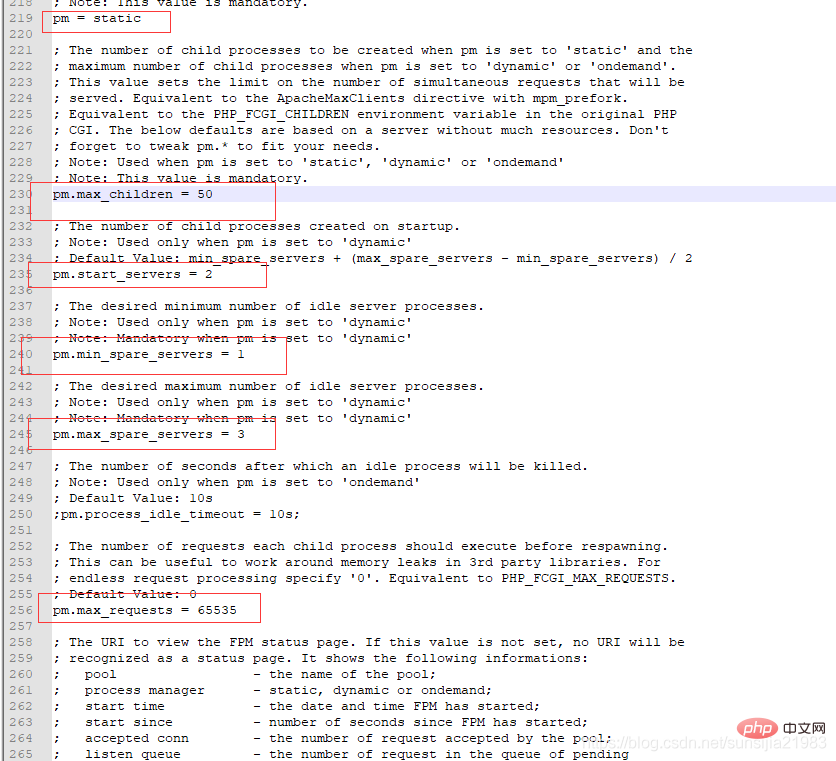
然后看的PHP 的配置文件


发现配置的 是 静态 配置的50个进程 四个主进程 每个配50个子进程 就200多个进程 进程太多了 平时的话 一般就六七个进程在处理 修改 进程数量 把50 改成10 这个进程数量 根据自己服务器的内存大小 来设置
查看当前php-fpm进程的内存占用情况及启动时间,命令如下:
ps -e -o 'pid,comm,args,pcpu,rsz,vsz,stime,user,uid'|grep www|sort -nrk5
查看当前php-fpm进程平均占用内存情况,一般来说一个php-fpm进程占用的内存为30-40MB,命令如下:
ps --no-headers -o "rss,cmd" -C php-fpm | awk '{ sum+=$1 } END { printf ("%d%s\n", sum/NR/1024,"M") }'然后我重启了PHP 指定配置文件
步骤
先 查找 然后 杀死
ps aux |grep php
kill 21605 (进程pid)
检测

启动
./php-fpm -y /usr/local/php/etc/php-fpm.conf
重启完 内存就降下来了
然后就事查找问题 猜测是内存泄露 但是不确定是哪里 对一些感觉有问题的地方 加上了unset()
然后检测 发现 内存一直都很平稳
如果内存还是一直增加 可以限制内存大小
设置方法:编辑php-fpm.conf配置文件
php_admin_value[memory_limit] = 128M(我服务器上的配置文件在/etc/php5/fpm/pool.d/www.conf 这个文件是被包含在php-fpm.conf里的) 后边的数字可以随便更改:32M,64M,128M,256M,512M,这个设置可根据你的服务器内存大小和你的需求来写,修改后要加载一下php-fpm服务。
这个时候 程序那个步骤出问题了 就说明哪里有内存泄露 但是也不是绝对的 这里还要了解一下 PHP的垃圾回收机制
如果你在一个进程里面 应该也是 累加的 也不是很好判断 就要根据程序 对不用的变量进程销毁 或者 限制 PHP的进程数量
注: 普通用户数据1000条 存在数组里面 大约占2246.2734375kb
2000 pieces of ordinary user data are stored in the array, accounting for approximately 4472.8671875kb
Recommended learning: "PHP Video Tutorial"
The above is the detailed content of What to do if there are too many php processes. For more information, please follow other related articles on the PHP Chinese website!

