Home >WeChat Applet >Mini Program Development >How to use echarts in the WeChat mini program and possible pitfalls, come and collect it to avoid lightning! !
How to use echarts in the WeChat mini program and possible pitfalls, come and collect it to avoid lightning! !
- 青灯夜游forward
- 2021-09-23 19:40:364445browse
This article will share with you some methods of using echarts in WeChat mini programs and a summary of problems, so that you can avoid pitfalls and thunderstorms. I hope it can help you!

How to use the WeChat mini program and some pitfalls, I hope it can help you
Using echarts in the WeChat mini program
1. Download the mini program version of echarts
Download address: https://github.com/ecomfe/echarts- for-weixin
2. Use steps
##1.Introduce project dependencies
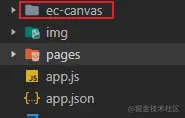
After pulling the WeChat applet version echarts from github, copy the ec-canvas file in the file to your own project. It is actually the dependency file of the WeChat applet version echarts. [Related learning recommendations:小program development tutorial】

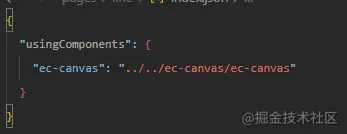
Introduce echarts into the json file of the page where echarts is used. The imported path is imported according to your own project structure.
You can also introduce it in the global configuration file app.json, so that everything is The page is universal and does not need to be introduced one by one. When multiple pages use echarts, it is more convenient Introduce echarts into the js file of the page using echarts. The imported path is imported according to your own project structure

Use the component
<view class="container">
  <ec-canvas id="mychart-dom-bar" canvas-id="mychart-bar" ec="{{ ec }}"></ec-canvas>
</view>
js code
For option configuration, you can go to the official website to read the documentation or refer to the example, https://echarts.apache.org /zh/option.html#title
import * as echarts from '../../ec-canvas/echarts';

const app = getApp();

function initChart(canvas, width, height, dpr) {
  //主要是这个 echarts 的创建
  const chart = echarts.init(canvas, null, {
    width: width,
    height: height,
    devicePixelRatio: dpr // new
  });
  canvas.setChart(chart);

  // option 的配置可以根据自己的需求去 echarts 官网查看配置的属性方法
  var option = {
    backgroundColor: "#ffffff",
    series: [{
      label: {
        normal: {
          fontSize: 14
        }
      },
      type: 'pie',
      center: ['50%', '50%'],
      radius: ['20%', '40%'],
      data: [{
        value: 55,
        name: '北京'
      }, {
        value: 20,
        name: '武汉'
      }, {
        value: 10,
        name: '杭州'
      }, {
        value: 20,
        name: '广州'
      }, {
        value: 38,
        name: '上海'
      }]
    }]
  };

  chart.setOption(option);
  return chart;
}

Page({
  data: {
    ec: {
      onInit: initChart
    }
  },

  onReady() {
  }
});
css code.container{
width: 100%;
height: 100vw;
}
ec-canvas {
width: 100%;
height: 100%;
}avoid pitfalls and step on thunder1. Regarding the introduction of dependencies, introduce Library, after using it according to the official usage method, the problem of echarts picture not being displayed
Solution: When using echarts in HTML, the width and height of the view tag wrapped in the outer layer must also be set (The official method style does not set the width and height of the outer element, but it can be displayed in the official example, which misleads many people and will lead to a trap)
 2 , About the role of
You can see that when echarts is initially created in the official code, the code is as shown below. After you set devicePixelRatio, the chart of echarts can be seen in the WeChat developer tools The pixels of the echarts chart are very poor. When previewed on a mobile phone, they are very clear. After removing the devicePixelRatio, the pixels of the echarts chart seen in the WeChat developer tools become very clear, but the pixels seen on the mobile phone are poor. , so this should be adapted to the pixels of the chart according to the pixel unit of the device

The above is the detailed content of How to use echarts in the WeChat mini program and possible pitfalls, come and collect it to avoid lightning! !. For more information, please follow other related articles on the PHP Chinese website!

