Home >Database >Mysql Tutorial >Share useful information! Summary of practical analysis of MySQL slow queries
Share useful information! Summary of practical analysis of MySQL slow queries
- 醉折花枝作酒筹Original
- 2021-07-30 14:16:122816browse
MySQL's slow query, the full name is slow query log, is a log record provided by MySQL, which is used to record statements whose response time exceeds the threshold in MySQL. We will introduce the static, and you can refer to it if necessary.
1 Why do we need to do this
1 What is slow SQL?
This refers to MySQL slow query, specifically refers to SQL whose running time exceeds the long_query_time value.
We often hear that the common MySQL binary logs include binlog, relay log relaylog, redo rollback log redolog, undolog, etc. For slow queries, there is also a slow query log, slowlog, which is used to record statements whose response time exceeds the threshold in MySQL.
Don’t be misled by the name slow query, thinking that the slow query log will only record select statements. In fact, it will also record insert, update and other DML statements whose execution time exceeds the threshold set by long_query_time.
# 查看慢SQL是否开启
show variables like "slow_query_log%";

# 查看慢查询设定的阈值 单位:秒
show variables like "long_query_time";
For the AliSQL-X-Cluster we use, which is XDB, slow query is enabled by default, and long_query_time is set to 1 second.
2 Why does slow query cause failure?
Real slow SQL is often accompanied by a large number of row scans, temporary file sorting or frequent disk flushes. The direct impact is that disk IO increases, normal SQL becomes slow SQL, and large-scale execution times out.
After last year’s Double 11, in response to the problems exposed on the technical side, the Cainiao CTO line launched multiple special governance projects. CTO-D each received one as a sponsor. My large team was responsible for the special project of slow SQL governance.
2 To what extent
1 How to measure the severity of slow SQL of an application?
Micro average
sum(aone应用慢SQL执行次数)
-----------------------
sum(aone应用SQL执行次数)
We believe that the larger the value, the greater the impact; the smaller the value, the impact may be small.
The extreme case is that every SQL executed in the application is all slow SQL, and the value is 1; every SQL executed in the application is not slow SQL, and the value is 0.
But the problem brought by this indicator is that the discrimination is not good, especially for SQL QPS is very high and in most cases the SQL is not a slow query. Occasional slow SQL will be overwhelmed.
Another question, is the occasional slow SQL really slow SQL? We encounter a lot of SQL that is recorded in the slow query log. In fact, it may be affected by other slow SQL, MySQL disk jitter, optimizer selection and other reasons, so that the performance of regular queries is obviously not slow SQL but becomes slow SQL.
Macro average
sum(慢SQL 1执行次数)    sum(慢SQL n执行次数)
-----------------  +  ------------------
sum(SQL 1执行次数)      sum(SQL n执行次数)
---------------------------------------
                   n
This algorithm is based on the fact that the caught slow SQL has a certain number of executions, which can reduce the impact of false slow SQL.
When the QPS of some applications is very low, that is, the number of times SQL is executed a day is very small, if false SQL is encountered, statistical errors will occur.
Number of executions
sum(aone应用慢SQL执行次数)
-----------------------
           7
Counting the average number of slow SQL executions per day in the past week can eliminate the false SQL problems caused by macro averaging.
Number of slow SQL templates
The above dimensions all have a time limit. In order to trace the historical processing of slow SQL, we also introduced the global dimension of the number of slow SQL templates.
count(distinct(aone应用慢SQL模板) )
2 Goal
Core Application: Solve all slow SQL
Common application: Micro average indicator dropped by 50%
3 CTO report
Based on CTO-D Based on the weighted average of the statistical summary application of the above multi-dimensional indicators, the unit is ranked from low to high, highlighting the top three, and broadcasts weekly.
三 Why should I do it
The guess may be related to my background. I have a C/C background. I was responsible for the design and implementation of the company-level remote multi-active architecture in my previous company. I know a little bit about MySQL.
In addition, it may have nothing to do with interests. The business of my small team has just started, and there is no slow SQL, so it can be inserted into various business lines.
四 Action support
1 Group MySQL protocol
Excerpt from index protocol:
[Mandatory 】Joining of more than three tables is prohibited. The data types of the fields that need to be joined must be absolutely consistent; when querying multi-table correlations, ensure that the fields being correlated need to have indexes.
Note: Even if you join a double table, you must pay attention to table indexes and SQL performance.
[Mandatory] When creating an index on a varchar field, the index length must be specified. It is not necessary to index the entire field. The index length is determined based on the actual text distinction.
Note: Index length and distinction are a pair of contradictions. Generally, for string type data, an index with a length of 20 will have a distinction of more than 90%. You can use count(distinct left(column name , determined by the distinction of index length))/count(*).
【Mandatory】Left blur or full blur is strictly prohibited in page search. If necessary, please use the search engine to solve the problem.
Note: The index file has the leftmost prefix matching feature of B-Tree. If the value on the left is undetermined, this index cannot be used.
[Recommended] Prevent implicit conversion caused by different field types, resulting in index failure.
[Reference] Avoid the following extreme misunderstandings when creating indexes:
1) It is better to have too many indexes than to lack them
认为一个查询就需要建一个索引。
2) 吝啬索引的创建
认为索引会消耗空间、严重拖慢更新和新增速度。
3) 抵制唯一索引
认为唯一索引一律需要在应用层通过“先查后插”方式解决。
2 DB变更标准
DDL需要控制变更速度,注意灰度和并发控制,变更发布需要在规定的变更发布窗口内。
五 分享一些我参与优化的例子
1 数据分布不均匀
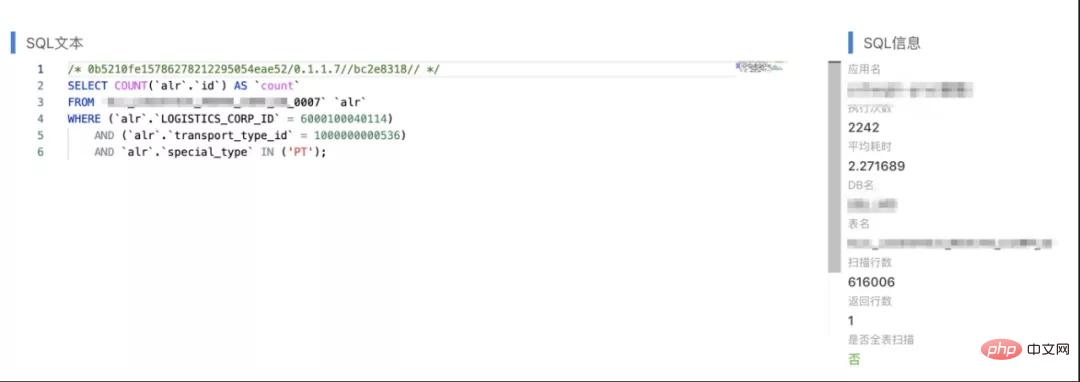
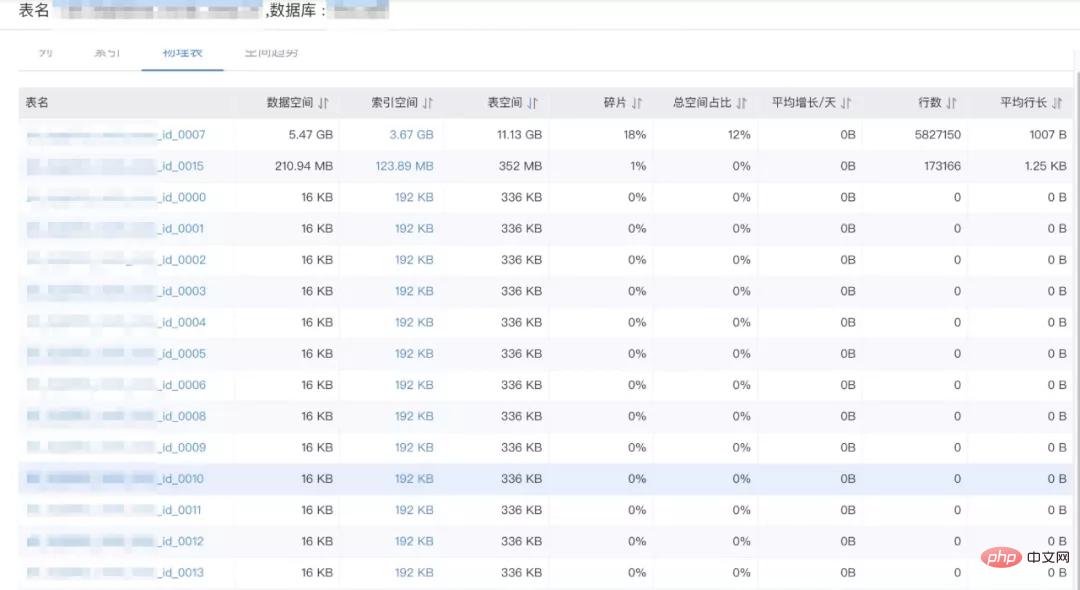
1)分库分表不合理
该业务数据分了8个库,每个库分了16张表,通过查看表空间可以看到数据几乎都分布在各个库的某2张表中。分库分表的策略有问题,另外过高预估了业务增量,这个持保留意见。
2)索引不合理
单表创建了idx_logistics_corp_id_special_id的联合索引,但即便这样区分度依然太低,根据实验及业务反馈(logistics_corp_id,transport_type_id)字段组合区分度非常高,且业务存在transport_type_id的单查场景。
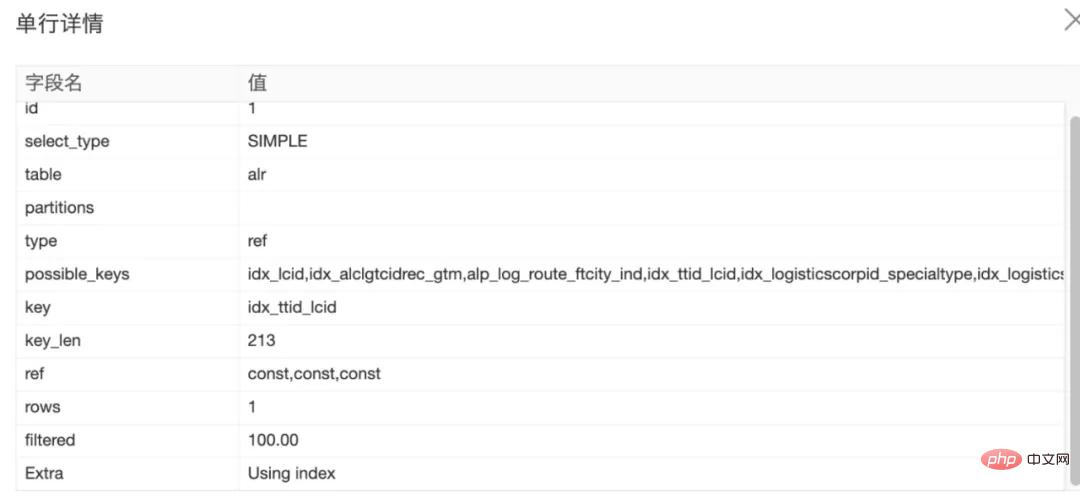
2 索引问题
SELECT
  COUNT(0) AS `tmp_count`
FROM(
    SELECT
      `table_holder`.`user_id`,
      `table_holder`.`sc_item_id`,
      SUM(
        CASE
          `table_holder`.`inventory_type`
          WHEN 1 THEN `table_holder`.`quantity`
          ELSE 0
        END
      ) AS `saleable_quantity`,
      SUM(
        CASE
          `table_holder`.`inventory_type`
          WHEN 1 THEN `table_holder`.`lock_quantity`
          ELSE 0
        END
      ) AS `saleable_lock_quantity`,
      SUM(
        CASE
          `table_holder`.`inventory_type`
          WHEN 401 THEN `table_holder`.`quantity`
          ELSE 0
        END
      ) AS `transfer_on_way_quantity`,
      `table_holder`.`store_code`,
      MAX(`table_holder`.`gmt_modified`) AS `gmt_modified`
    FROM
      `table_holder`
    WHERE(`table_holder`.`is_deleted` = 0)
      AND(`table_holder`.`quantity` > 0)
      AND `table_holder`.`user_id` IN(3405569954)
      AND `table_holder`.`store_code` IN('ZJJHBHYTJJ0001', '...1000多个')
    GROUP BY
      `table_holder`.`user_id`,
      `table_holder`.`sc_item_id`
    ORDER BY
      `table_holder`.`user_id` ASC,
      `table_holder`.`sc_item_id` ASC
  ) `a`;
这个case对应的表有store_code索引,因此认为没问题,没办法优化了。实则通过执行计划,我们发现MySQL选择了全表扫描。针对该case实践发现,当范围查询的个数超过200个时,索引优化器将不再使用该字段索引。
最终经过拉取最近一段时间的相关查询SQL,结合业务的数据分布,我们发现采用(is_deleted,quantity)即可解决。
判断执行计划采用的索引长度:key_len的长度计算公式(>=5.6.4)
char(10)允许NULL      =  10 * ( character set:utf8mb4=4,utf8=3,gbk=2,latin1=1) + 1(NULL)
char(10)不允许NULL    =  10 * ( character set:utf8mb4=4,utf8=3,gbk=2,latin1=1)
varchr(10)允许NULL    =  10 * ( character set:utf8mb4=4,utf8=3,gbk=2,latin1=1) + 1(NULL) + 2(变长字段)
varchr(10)不允许NULL  =  10 * ( character set:utf8mb4=4,utf8=3,gbk=2,latin1=1) + 2(变长字段)
int允许NULL           =  4 + 1(NULL)
int不允许NULL         =  4
timestamp允许NULL     =  4 + 1(NULL)
timestamp不允许NULL   =  4
datatime允许NULL      =  5 + 1(NULL)
datatime不允许NULL    =  5
3 被人影响
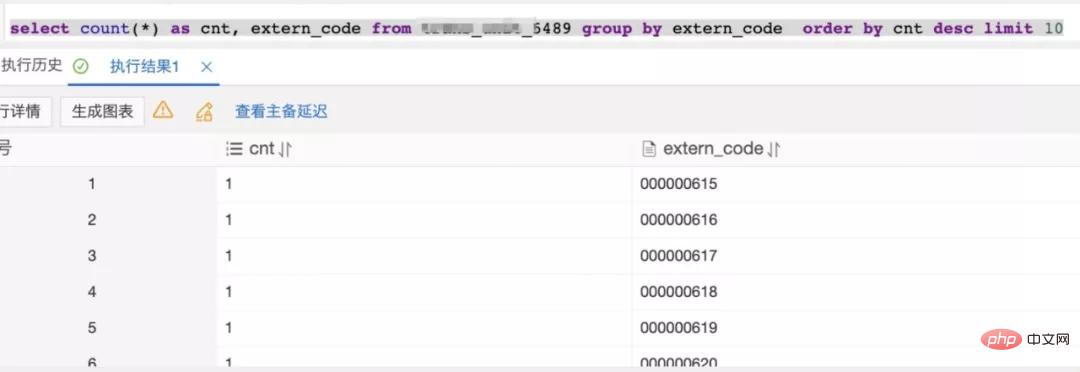
用到了索引却依然被爆出扫描2千万行:
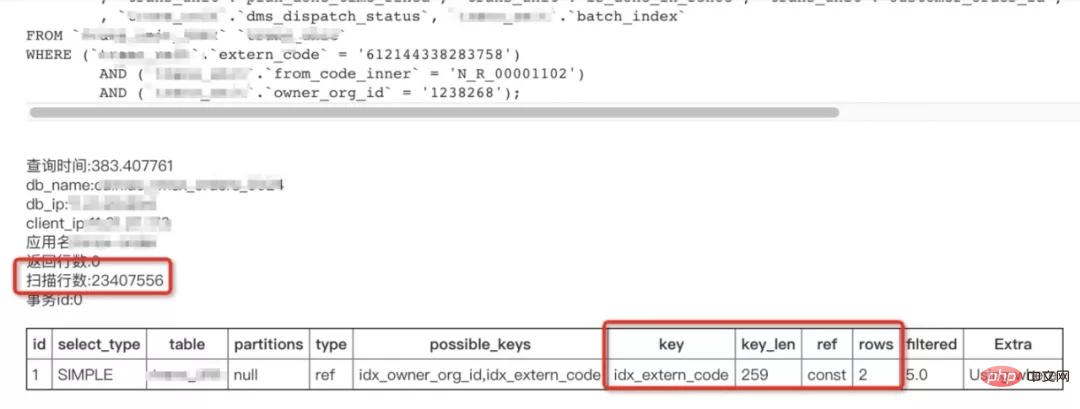
索引字段区分度很高:
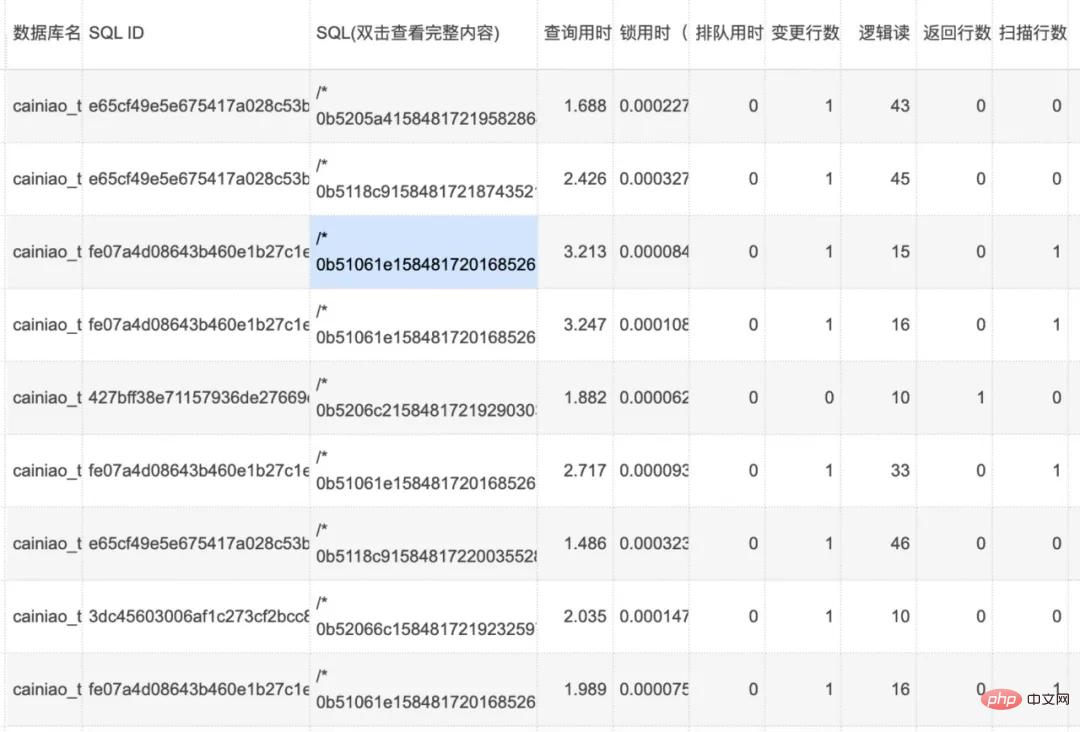
同时期常规SQL变为了慢查询:
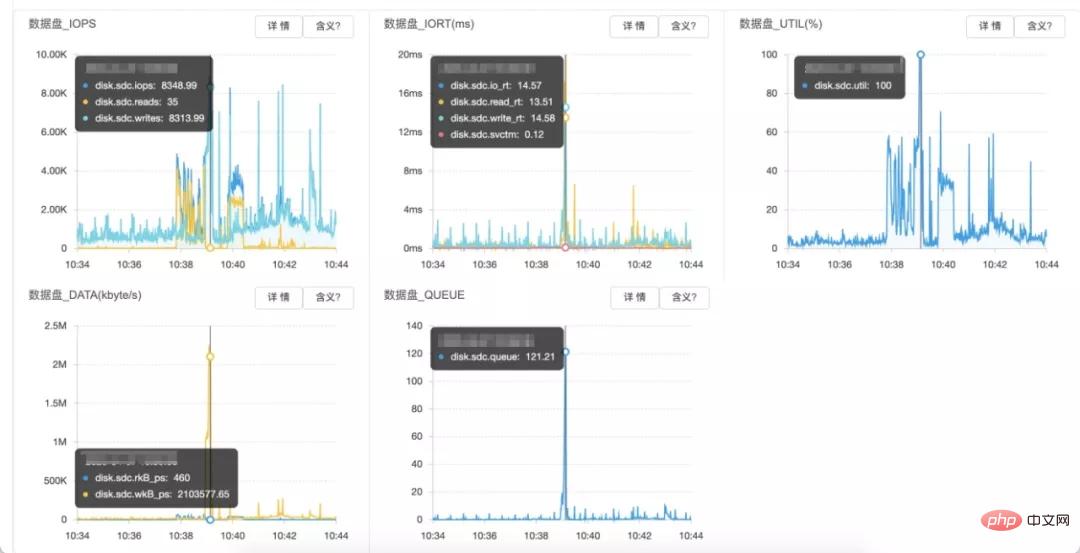
DB数据盘访问情况:
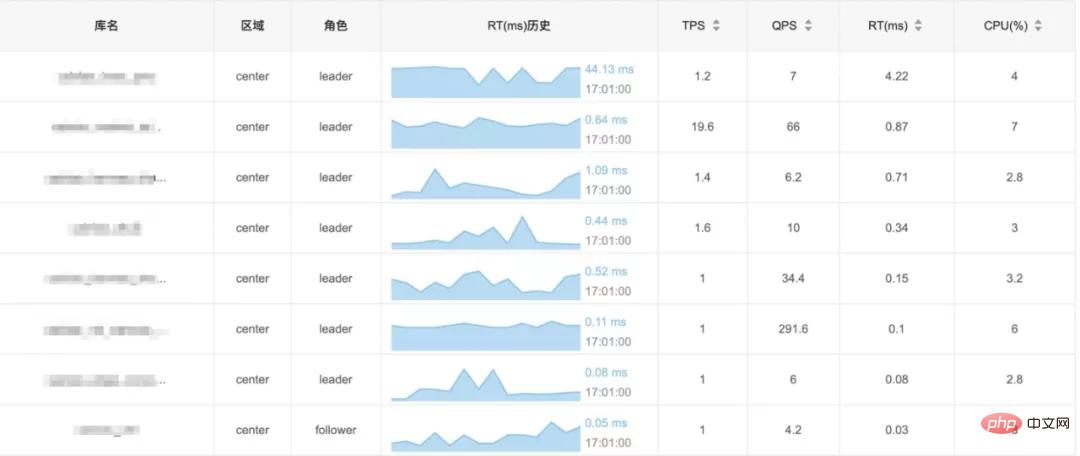
排查共用物理机其他实例的情况,发现有个库在问题时间附近有很多慢sql需要排序,写临时文件刚好写入了2GB:

多个MySQL实例leader节点混合部署在同一台物理机,虽然通过docker隔离了CPU、MEM等资源,但目前还没有做到buffer io的隔离。
4 无法解决
通过汇总分析高频的查询并结合业务得出合适的索引往往能够解决日常遇到的慢查询,但这并不是万能的。
比如有可能索引越加越多,乃至成了这样:

有些场景,比如支持多个字段组合查询,又没有必填项,如果都要通过索引来支持显然是不合理的。

查询场景下,将区分度较高的字段设定为必填项是个好习惯;查询组合很多的情况下考虑走搜索支持性更好的存储或者搜索引擎。
六 日常化处理
随着各个CTO-D线的深入治理,各项指标较之前均有非常大的改观,比如核心应用完成慢查询清零,影响最大的一些慢SQL被得以解决,而我所在的团队排名也由最初的尾部top3进入到头部top3。
慢SQL治理进入日常化,通过每周固定推送慢SQL工单、owner接手处理、结单,基本形成了定期清零的习惯和氛围,慢SQL治理专项也被多次点名表扬。
7 Summary
This is a belated summary. Looking back now, I feel that the process of strategy formulation, problem analysis and solution is quite worth sharing with everyone.
Related recommendations: "mysql tutorial"
The above is the detailed content of Share useful information! Summary of practical analysis of MySQL slow queries. For more information, please follow other related articles on the PHP Chinese website!

