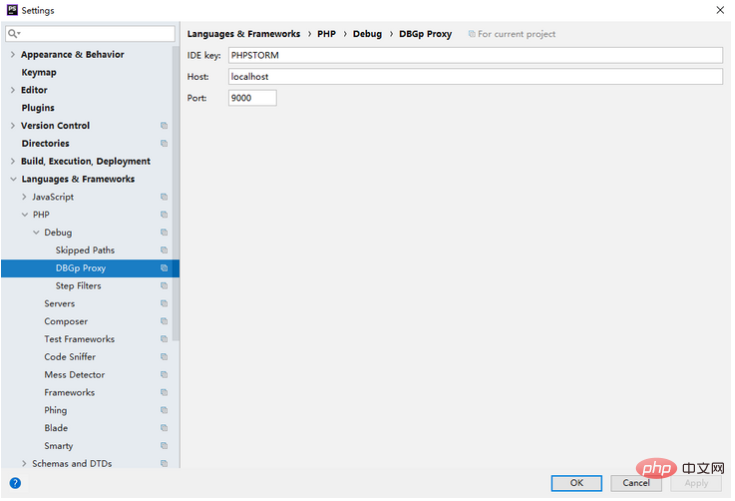
To debug a single PHP file, you need to configure the DBgp parameters, which can be consistent with the xdebug configuration parameters. As shown below. 
After that, select php script in run>edit configurations to debug a single php file. 
Home >Development Tools >phpstorm >Introducing the configuration of xdebug in PHPSTORM
The following tutorial column will introduce the configuration of xdebug in PHPSTORM. I hope it will be helpful to friends in need!
xdebug configuration in PHPSTORM php configuration: enable xdebug
   xdebug.remote_enable = on
   xdebug.auto_trace = on
   xdebug.remote_handler=dbgp
   xdebug.remote_host=localhost
   xdebug.remote_port=9000
   xdebug.idekey=PHPSTORM
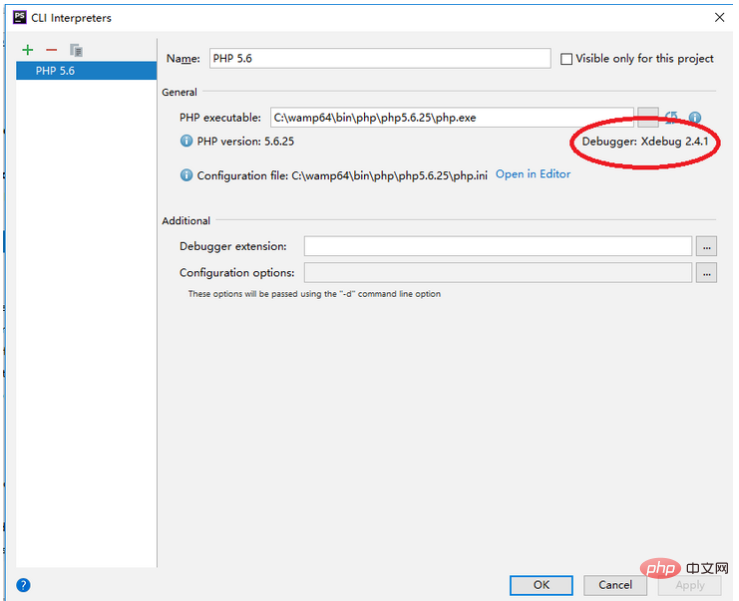
After the configuration is completed, open phpstorm and set the parser of php. At this time, you should see that the xdebug extension has been installed, otherwise check the configuration file.
To debug a single PHP file, you need to configure the DBgp parameters, which can be consistent with the xdebug configuration parameters. As shown below. 
After that, select php script in run>edit configurations to debug a single php file. 
The above is the detailed content of Introducing the configuration of xdebug in PHPSTORM. For more information, please follow other related articles on the PHP Chinese website!