Home >Topics >Pagoda Panel >What does the data in the Pagoda's load status represent?
What does the data in the Pagoda's load status represent?
- 藏色散人forward
- 2021-02-28 16:41:532932browse
The following tutorial column of Pagoda Panel will introduce to you the data in the load average of the Pagoda Panel. I hope it will be helpful to friends in need!

The meaning of the percentage in the Pagoda's load status chart:
Below 50% - At this time, the server is running in a low load state
50 ~ 90% - The server load is normal, and the user's request can be responded to by the server in time
90% ~ 100% - It means that the server resources have been exhausted and cannot respond to the user's request in time, and it needs to be responded as soon as possible Check whether the project is running abnormally, or increase the server configuration
Factors affecting server load:
1. CPU usage
2. Number of threads
3. IO usage
4. Swap usage
5. Insufficient resource allocation due to excessive host load
*** Such as Ali For cloud burst performance machines, even if you see that the above four data are normal, but your load is sometimes very high, it may be caused by host limitations.
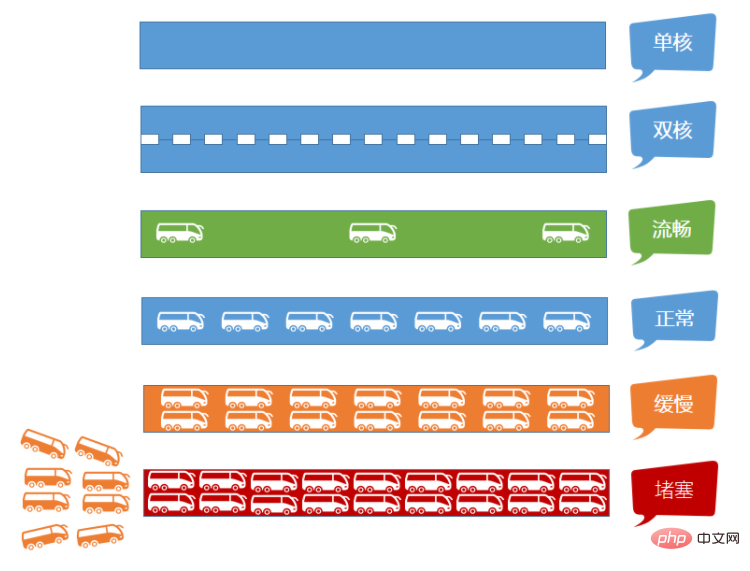
Let’s take a motor vehicle road as an example. The performance of the server under different load conditions
Assumptions:
Number of CPU cores = Number of lanes
Memory = Lane width
Disk IO = Lane limit speed

The above is the detailed content of What does the data in the Pagoda's load status represent?. For more information, please follow other related articles on the PHP Chinese website!

