
Home >Web Front-end >JS Tutorial >An introduction to several methods for debugging Node.js
An introduction to several methods for debugging Node.js

- 青灯夜游forward
- 2020-11-24 18:01:043301browse
Related recommendations: "nodejs Tutorial"
Debugging is an essential tool for solving program problems. In the early days, debugging Node was a bit troublesome. , the community also has many toolkits to assist. Now Node debugging is relatively simple. There are several commonly used
Chrome DevTools
Chrome developer tools interact through the V8 Inspector Protoco debugging protocol and use websocket Interact with development tools, providing a graphical debugging interface, the operation is very simple
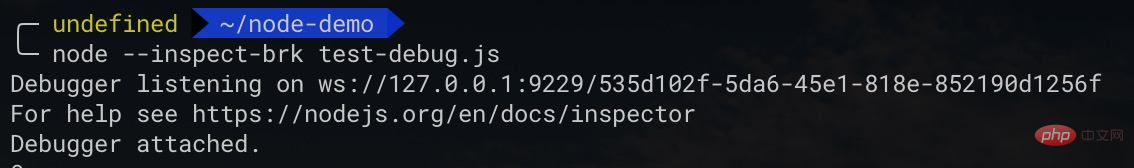
#1 Command line --inspect-brk
Use the command linenode --inspect-brk YOUR_FILE_PATH .js
#2 Browser inspect interface
Use Chrome to open the addresschrome://inspect and click Remote The file name "inspect" button for debugging in Target
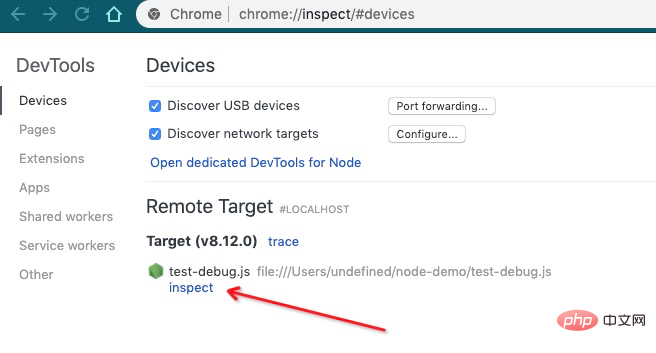
#3 Enter the Chrome debugging interface
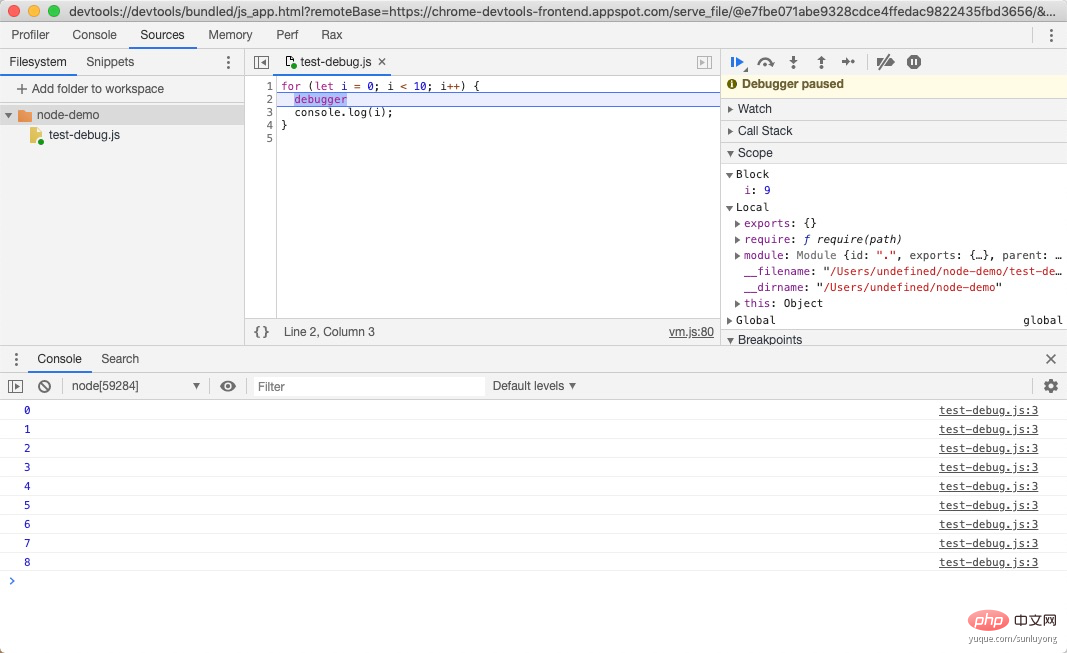
- -inspect-brk will stop the first line of user code before execution to prevent the execution of the code from ending before debugging. The web service script will always run in the background. Just use --inspect
VS Code
The above operation steps are still a little troublesome. Most IDEs have encapsulated debugging interfaces, which can truly achieve one-click debugging. VS Code is almost the de facto standard IDE for the front end. Let’s briefly introduce it. Debugging method
#1 Click the debug button
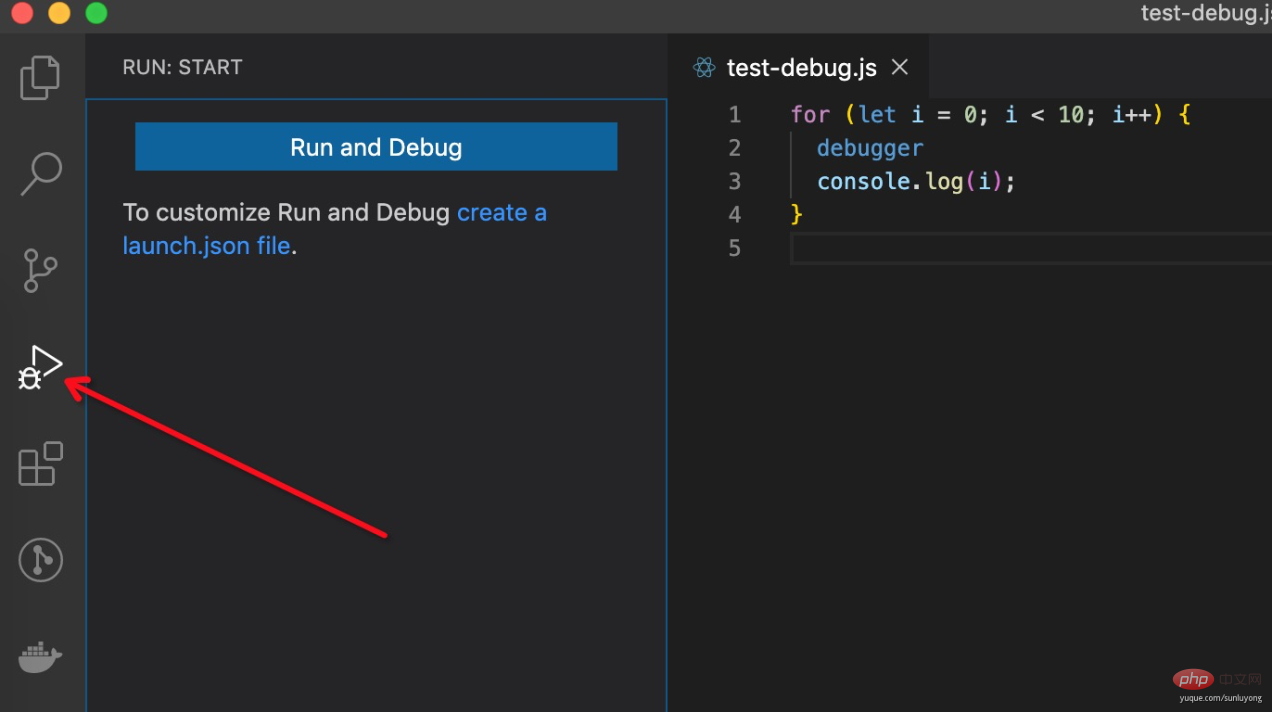
#2 Create launch.json
You need to create one for first debugging launch.json file, the default value will be generated after clicking
{
  // Use IntelliSense to learn about possible attributes.
  // Hover to view descriptions of existing attributes.
  // For more information, visit: https://go.microsoft.com/fwlink/?linkid=830387
  "version": "0.2.0",
  "configurations": [
    {
      "type": "node",
      "request": "launch",
      "name": "Launch Program",
      "skipFiles": [
        "<node_internals>/**"
      ],
      "program": "${file}"
    }
  ]
}
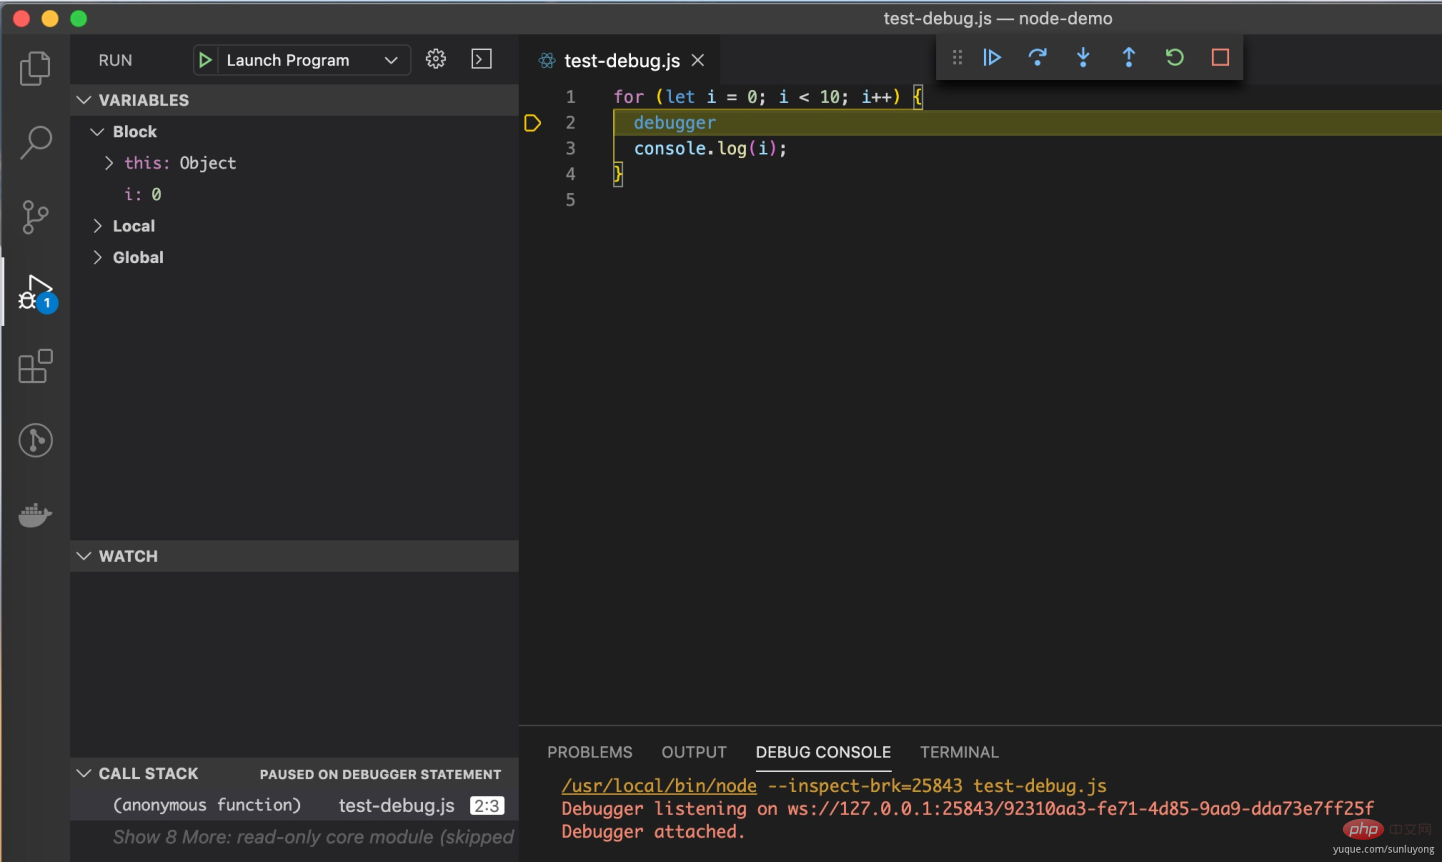
Generally, what needs to be modified is program, and the debugging file is specified through program
-
${file}Debug the current file -
${workspaceFolder}\\index.jsDebug the index.js entry file of the project directory
#3 Click “Launch Program”
Detailed operation and configuration reference https://code.visualstudio.com/docs /nodejs/nodejs-debugging
For more programming-related knowledge, please visit: Programming Video Course! !
The above is the detailed content of An introduction to several methods for debugging Node.js. For more information, please follow other related articles on the PHP Chinese website!