
jpgraph 图表

- PHP中文网Original
- 2016-05-25 16:58:471091browse
1. [代码][PHP]代码
<?php
// header("Content-type: image/jpg");
error_reporting(E_ALL ^ E_NOTICE);
include ("jpgraph/jpgraph.php");
include ("jpgraph/jpgraph_bar.php");
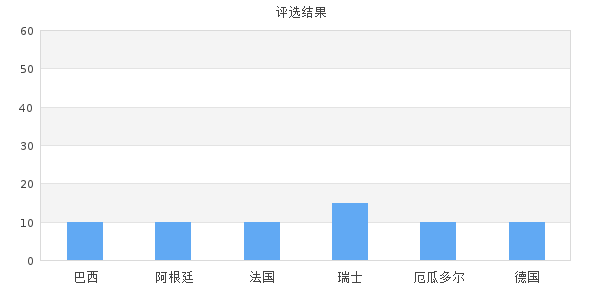
$data2y=array(10,10,10,15,10,10);
$graph = new Graph(600,300,"auto"); //创建画布
$graph->SetScale('textlin',0,60); // 设置y轴的值 这里是0到60
//$graph->SetScale("textlin");
// $graph->yaxis->scale->SetGrace(0,60);
//创建画布阴影
$graph->SetShadow();
$graph->img->SetMargin(40,30,30,40);//设置显示区左、右、上、下距边线的距离,单位为像素
$bplot = new BarPlot($data2y);//创建一个矩形的对象
$bplot->SetFillColor('red'); //设置柱形图的颜色
$bplot->value->Show();//设置显示数字
$bplot->value->SetFormat('%d');//在柱形图中显示格式化的评选结果
$graph->Add($bplot);//将柱形图添加到图像中
$graph->SetMarginColor("lightblue");//设置画布背景色为淡蓝色
$graph->title->Set("评选结果");//创建标题
$vote_content=array('巴西','阿根廷','法国','瑞士','厄瓜多尔','德国');
$graph->xaxis->SetTickLabels($vote_content); //设置X坐标轴文字
$graph->title->SetFont(FF_SIMSUN);//设置字体
$graph->xaxis->SetFont(FF_SIMSUN); //设置字体
// $graph->Stroke();//输出矩形图表
$graph->Stroke();
?>
2. [图片] test.php.png
Statement:
The content of this article is voluntarily contributed by netizens, and the copyright belongs to the original author. This site does not assume corresponding legal responsibility. If you find any content suspected of plagiarism or infringement, please contact admin@php.cn
Previous article:PHP Word & Excel 转 PDFNext article:采集远程网址数据