
 Web Front-endJS TutorialUse Chart.js chart library to create beautiful responsive forms_javascript tips
Basics for entry
Chart.js is an open source chart library based on HTML5, which can draw beautiful charts conveniently and concisely.
Key features include:
1. Supports 6 different table types: curve chart, bar chart, pie chart, radar chart, polar coordinate area chart, and ring chart.
2. Developed based on HTML5 and supports all browsers (including IE7/8).
3. It does not depend on any other libraries, is only 4.5k in size, and can be customized.
Chart.js is a responsive, flexible and lightweight charting library based on HTML5 canvas. There are six different chart types available in the library, each with a range of customization options. If that's not enough, you can also create your own chart types.
The code for the six chart types of Chart.js is only 11 kb in total and is gzip compressed. In addition, the library is modular, so you can only use the chart types you need, thus further saving space. Below is the cdnjs link that contains the library.
JavaScript
<script src="https://cdnjs.cloudflare.com/ajax/libs/Chart.js/1.0.2/Chart.min.js"></script>
Available settings
From tool tips to animation effects (Proofreader’s note: tool tip refers to the tool tip that pops up when the mouse moves over an element), Chart.js allows you to change almost all characteristics of the chart. In this section, I'll modify some settings to show how Chart.js is created. We'll start with the following HTML code:
XHTML
<canvas id="canvas"></canvas>
For the first presentation, I will create a line chart. There are a few basic options that need to be set in order for the chart to make sense. Line charts require an array of labels and a dataset. Labels will appear on the X-axis. I've mocked up some data for a line chart, separated into an array, each with its own fill color, line and point set.
In this example, I set fillColor to transparent. If you do not set a fillColor value, it will default to black or gray. The same applies to other values. Colors are defined using RGBA, RGB, hex or HSL formats, the same as CSS.
JavaScript
var lineData = {
 labels: ['Data 1', 'Data 2', 'Data 3', 'Data 4',
      'Data 5', 'Data 6', 'Data 7'],
 datasets: [{
  fillColor: 'rgba(0,0,0,0)',
  strokeColor: 'rgba(220,180,0,1)',
  pointColor: 'rgba(220,180,0,1)',
  data: [20, 30, 80, 20, 40, 10, 60]
 }, {
  fillColor: 'rgba(0,0,0,0)',
  strokeColor: 'rgba(151,187,205,1)',
  pointColor: 'rgba(151,187,205,1)',
  data: [60, 10, 40, 30, 80, 30, 20]
 }]
}
Set global options
In the code I have set some global values. animationSteps determines the duration of the animation. As needed, you can modify more options, such as scaleLineColor and scaleIntegersOnly. I recommend browsing the Chart.js documentation to see what other options are available in the library.
JavaScript
Chart.defaults.global = {
 animationSteps : 50,
 tooltipYPadding : 16,
 tooltipCornerRadius : 0,
 tooltipTitleFontStyle : 'normal',
 tooltipFillColor : 'rgba(0,160,0,0.8)',
 animationEasing : 'easeOutBounce',
 scaleLineColor : 'black',
 scaleFontSize : 16
}
Set exclusive chart options
In addition to global options, there are some configuration options for specific chart types. In this line chart, I will set such options, hoping to inspire you:
JavaScript
Chart.defaults.global = {
animationSteps : 50,
tooltipYPadding : 16,
tooltipCornerRadius : 0,
tooltipTitleFontStyle : 'normal',
tooltipFillColor : 'rgba(0,160,0,0.8)',
animationEasing : 'easeOutBounce',
scaleLineColor : 'black',
scaleFontSize : 16
}
Charts generated by Chart.js are non-responsive by default. Setting responsive to true turns it into a responsive chart. If you need to make every chart responsive, I recommend setting a global value, like this:
JavaScript
Chart.defaults.global.responsive = true;
Below you will see an example of this line chart:
See the Pen Chart.js Responsive Line Chart Demo by SitePoint (@SitePoint) on CodePen.
Add and remove dynamic data
Sometimes you need to display data that changes all the time. The stock market is a typical example of this application scenario. In this section I will create a column chart and add data while dynamically deleting data. I'll use some random data and present the data as a column chart in this example. Most of the code in this example is similar to the previous example. Once we have our HTML (same as in the previous example), we can add our own JavaScript.
First we need to write code to populate the chart with dynamic data. I use a function expression to generate a random value and then assign it to a variable dData. These values will give us random data when we need to change it. Like the previous example, I created a labels array and dataset, and set an arbitrary fillColor.
JavaScript
var dData = function() {
 return Math.round(Math.random() * 90) + 10;
};
var barData = {
 labels: ['dD 1', 'dD 2', 'dD 3', 'dD 4',
      'dD 5', 'dD 6', 'dD 7', 'dD 8'],
 datasets: [{
  fillColor: 'rgba(0,60,100,1)',
  strokeColor: 'black',
  data: [dData(), dData(), dData(), dData(),
      dData(), dData(), dData(), dData()]
 }]
}
Now it’s time to write the code to remove and add bars to our chart. At the beginning we initialized the index value to 11, and I used two methods: removeData() and addData(valuesArray,label). Calling the instance's removeData() method removes the first value from all data sets in the chart. In the barChartDemo example, the first value of the data set is removed. Calling addData() passes an array value along with the label, adding a new data node at the end of the chart. The code snippet below updates the chart every 3 seconds.
JavaScript
var index = 11;
var ctx = document.getElementById('canvas').getContext('2d');
var barDemo = new Chart(ctx).Bar(barData, {
 responsive: true
});
setInterval(function() {
 barDemo.removeData();
 barDemo.addData([dData()], 'dD ' + index);
 index++;
}, 3000);
Another way to update chart values is to set the values directly. In the example below, the first line sets the value of the second bar of the first data set to 60. If you update at this point, the bar will animate its current value to 60.
JavaScript
barDemo.datasets[0].bars[2].value = 60;
barDemo.update();
这里是柱形图的示例(由SitePoint在CodePen上创建):
See the Pen Chart.js Responsive Bar Chart Demo by SitePoint (@SitePoint) on CodePen.
结论
这个教程覆盖了关于 Chart.js 的一些重要功能。第一个例子展示了一些全局设置的使用,同时,Chart.js也为每个图表类型提供了专属的自定义设置。如果当前可用的图表无法满足你的需求,你还可以创造自己的图表类型。我推荐你浏览文档,加深关于该库什么可以做,什么无法做的认识。

 Replace String Characters in JavaScriptMar 11, 2025 am 12:07 AM
Detailed explanation of JavaScript string replacement method and FAQ This article will explore two ways to replace string characters in JavaScript: internal JavaScript code and internal HTML for web pages. Replace string inside JavaScript code The most direct way is to use the replace() method: str = str.replace("find","replace"); This method replaces only the first match. To replace all matches, use a regular expression and add the global flag g: str = str.replace(/fi
 Custom Google Search API Setup TutorialMar 04, 2025 am 01:06 AM
This tutorial shows you how to integrate a custom Google Search API into your blog or website, offering a more refined search experience than standard WordPress theme search functions. It's surprisingly easy! You'll be able to restrict searches to y
 Build Your Own AJAX Web ApplicationsMar 09, 2025 am 12:11 AM
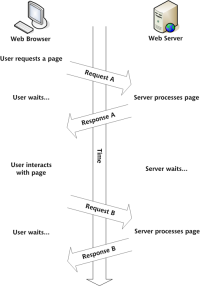
So here you are, ready to learn all about this thing called AJAX. But, what exactly is it? The term AJAX refers to a loose grouping of technologies that are used to create dynamic, interactive web content. The term AJAX, originally coined by Jesse J
 Example Colors JSON FileMar 03, 2025 am 12:35 AM
This article series was rewritten in mid 2017 with up-to-date information and fresh examples. In this JSON example, we will look at how we can store simple values in a file using JSON format. Using the key-value pair notation, we can store any kind
 10 jQuery Syntax HighlightersMar 02, 2025 am 12:32 AM
Enhance Your Code Presentation: 10 Syntax Highlighters for Developers Sharing code snippets on your website or blog is a common practice for developers. Choosing the right syntax highlighter can significantly improve readability and visual appeal. T
 8 Stunning jQuery Page Layout PluginsMar 06, 2025 am 12:48 AM
Leverage jQuery for Effortless Web Page Layouts: 8 Essential Plugins jQuery simplifies web page layout significantly. This article highlights eight powerful jQuery plugins that streamline the process, particularly useful for manual website creation
 10 JavaScript & jQuery MVC TutorialsMar 02, 2025 am 01:16 AM
This article presents a curated selection of over 10 tutorials on JavaScript and jQuery Model-View-Controller (MVC) frameworks, perfect for boosting your web development skills in the new year. These tutorials cover a range of topics, from foundatio
 What is 'this' in JavaScript?Mar 04, 2025 am 01:15 AM
Core points This in JavaScript usually refers to an object that "owns" the method, but it depends on how the function is called. When there is no current object, this refers to the global object. In a web browser, it is represented by window. When calling a function, this maintains the global object; but when calling an object constructor or any of its methods, this refers to an instance of the object. You can change the context of this using methods such as call(), apply(), and bind(). These methods call the function using the given this value and parameters. JavaScript is an excellent programming language. A few years ago, this sentence was


Hot AI Tools

Undresser.AI Undress
AI-powered app for creating realistic nude photos

AI Clothes Remover
Online AI tool for removing clothes from photos.

Undress AI Tool
Undress images for free

Clothoff.io
AI clothes remover

AI Hentai Generator
Generate AI Hentai for free.

Hot Article
Hot Tools

WebStorm Mac version
Useful JavaScript development tools

MinGW - Minimalist GNU for Windows
This project is in the process of being migrated to osdn.net/projects/mingw, you can continue to follow us there. MinGW: A native Windows port of the GNU Compiler Collection (GCC), freely distributable import libraries and header files for building native Windows applications; includes extensions to the MSVC runtime to support C99 functionality. All MinGW software can run on 64-bit Windows platforms.

Dreamweaver CS6
Visual web development tools

Atom editor mac version download
The most popular open source editor

SublimeText3 English version
Recommended: Win version, supports code prompts!

