Home >Development Tools >phpstorm >How to use Xdebug to debug code in phpstorm
How to use Xdebug to debug code in phpstorm
- coldplay.xixiforward
- 2020-07-02 17:29:038412browse

Students who have used static languages such as Java and C# often set a breakpoint when debugging the code and then debug it easily, while PHPer often debugs the code. It's
echo $a;exit;
It's very inconvenient. Some students sometimes commit after setting breakpoints without deleting them. This causes a lot of trouble. Is there any way to debug more elegantly? Woolen cloth? Of course, there is. Here we use a PHP module xdebug, xdebug installation tutorial, using it for PHP code debugging can effectively reduce the workload and BUG debugging time, especially in some complex programs, you can't find it just by looking. Problem
Related learning recommendations:phpstrom usage tutorial
Xdebug is an open source The code's PHP program debugger (i.e. a Debug tool) can be used to track, debug and analyze the running status of PHP programs.
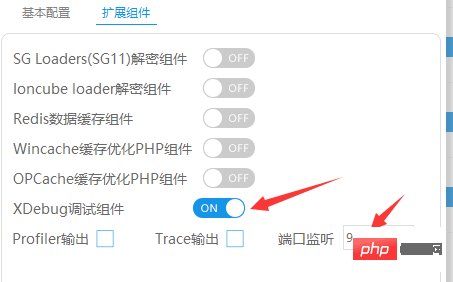
- If it is an integrated environment, such as phpstudy, you don’t need to install it yourself, just set the environment->PHP-> (don’t get confused with the PHP version number)

- Set the port number here, just follow your preference. I set it to 9001

- Check phpinfo and search, just find the xdebug module
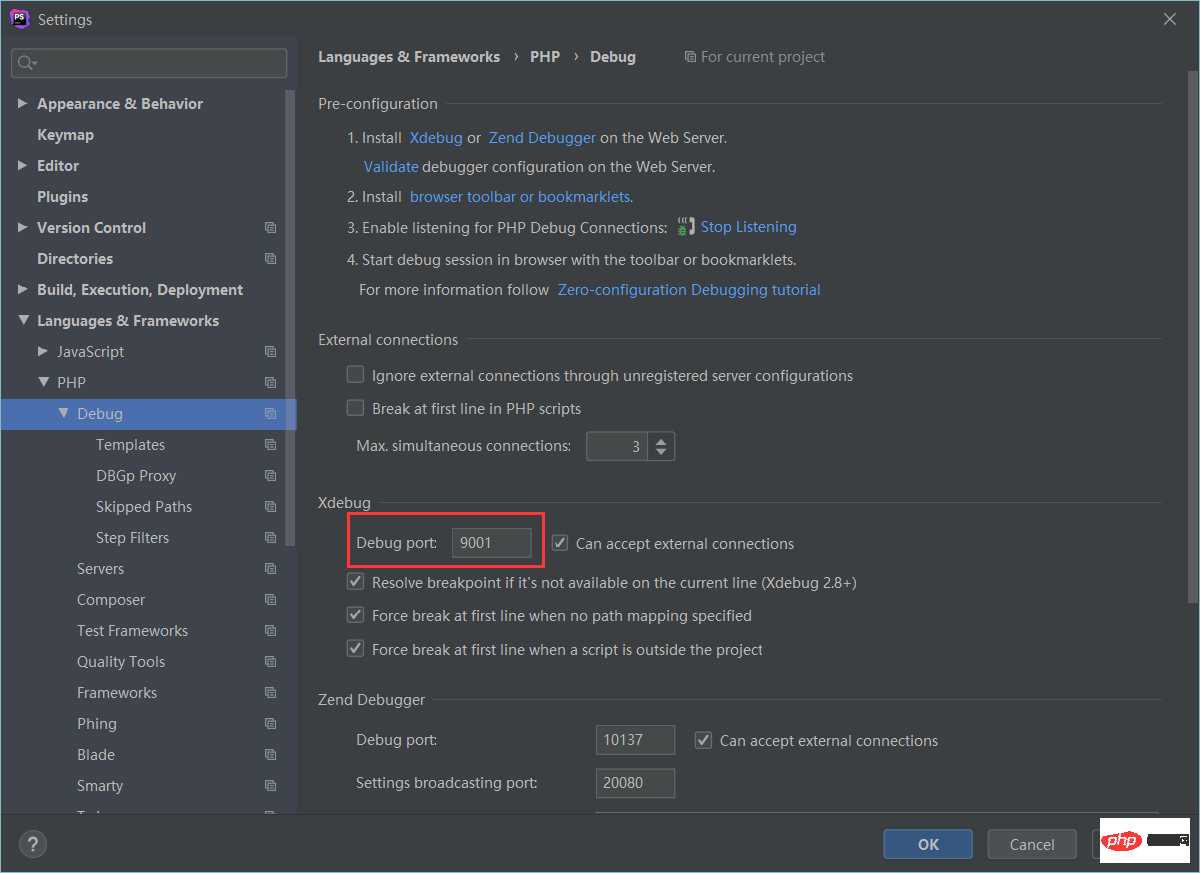
Next open phpstorm, ctrl alt s to open the settings
Come to the debug settings and change the port to the port number you set earlier (others can be defaulted) , of course it can also be turned on. If you don’t understand English, you can translate it)

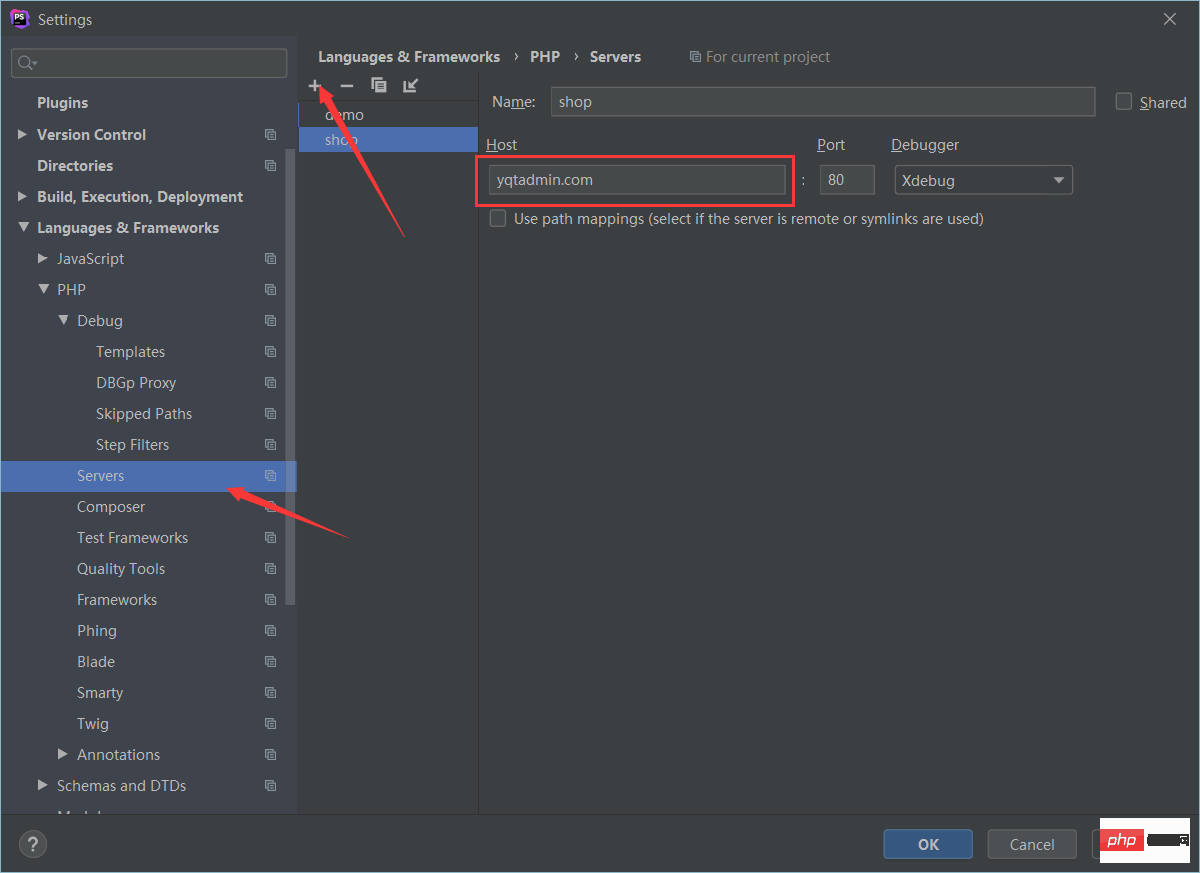
Click on Servers, click on the number to create a new one, with a random name, and fill in the domain name you want to debug as Host ( For example, localhost, I filled in a virtual domain name here), the default port number is 80

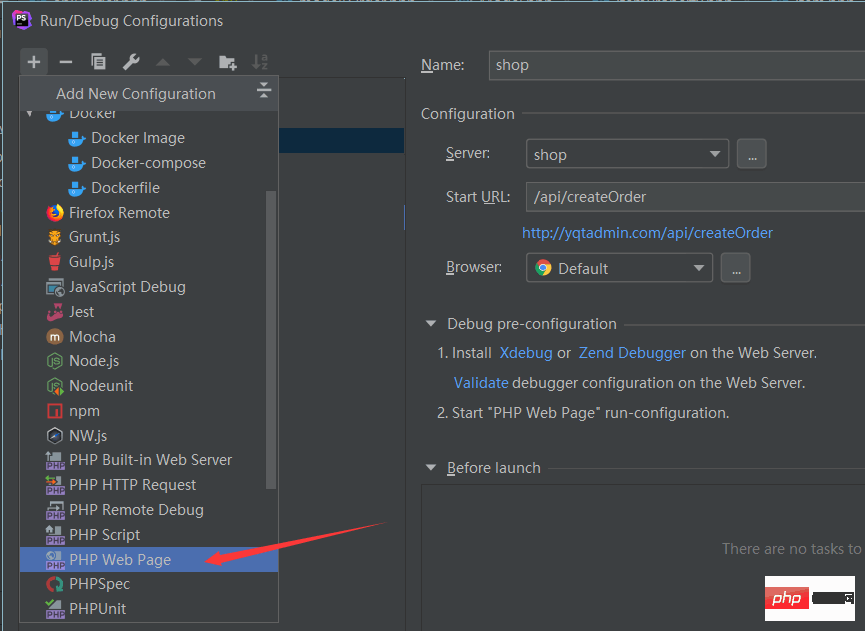
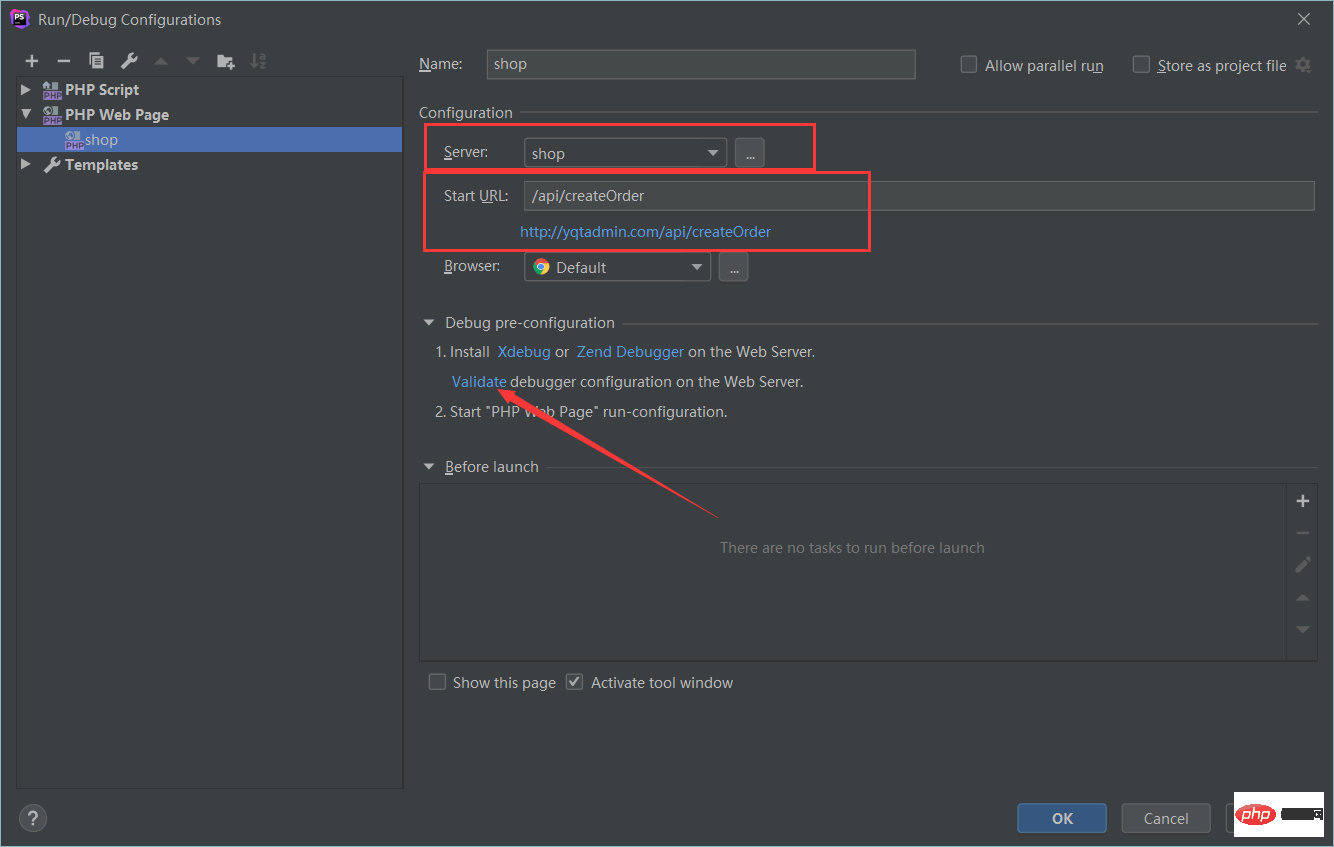
Then there is Edit Configurations in the upper right corner, click to open

Click the plus sign to add a PHP Web Page

The name is whatever you want. Select the Server you just configured. startUrl is the interface address to start. If I wanted to debug an ordering interface, so I filled it in, and then clicked on the Validate


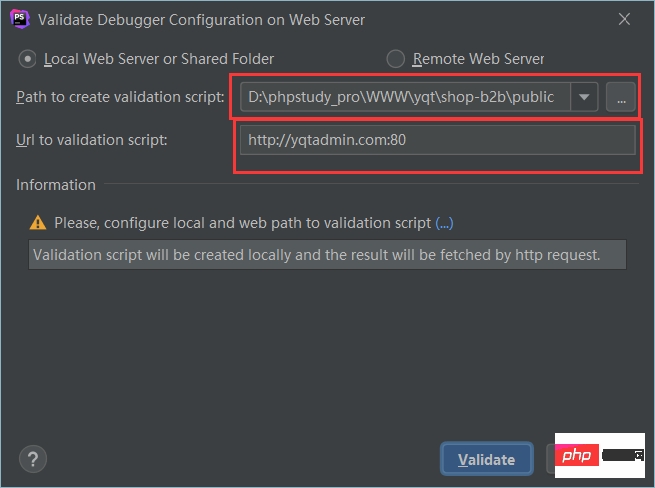
# The first is remote debugging. I won’t talk about remote here, so as not to confuse you.

Fill in your own project directory in the first input box, because mine is a tinkphp framework, so I put it Point to the public directory of the project directory

The second one fills in your own domain name. The editor here automatically fills in the

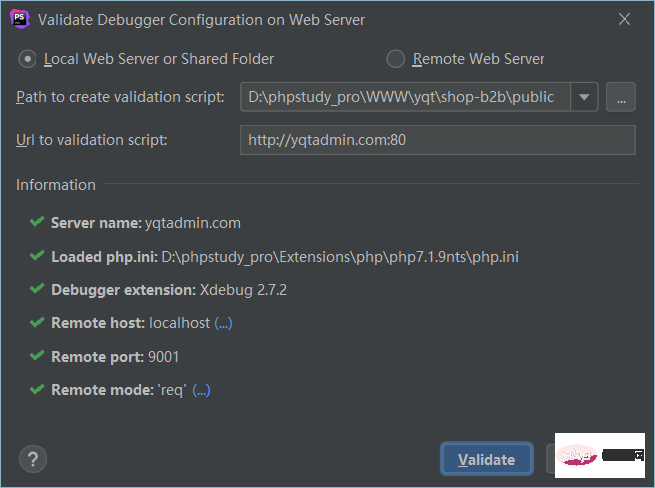
click Validate button, phpstorm will help detect whether the configuration is correct. If there is an error, please modify it according to the prompts

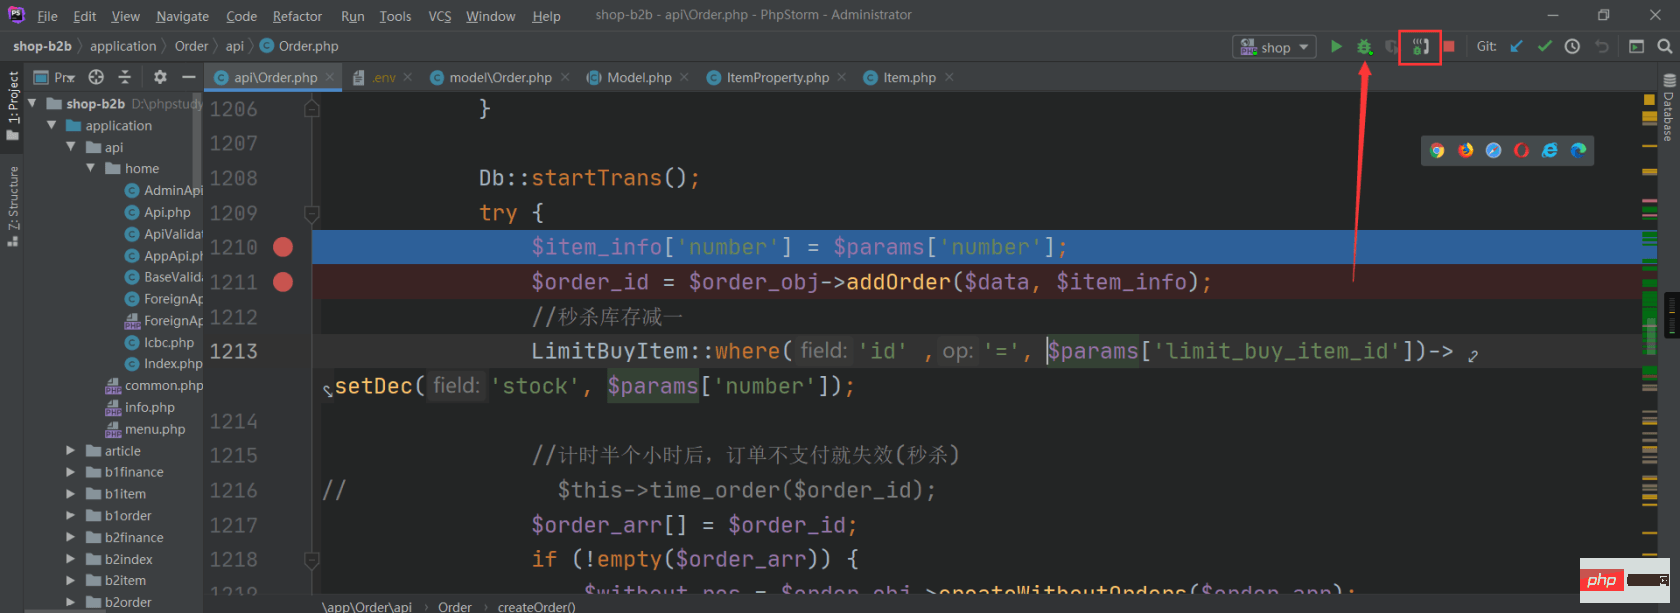
Finally, click on the bug in the upper right corner, and the browser will automatically open for debugging. If the phone next to the bug turns green, it means it is listening on port 9001
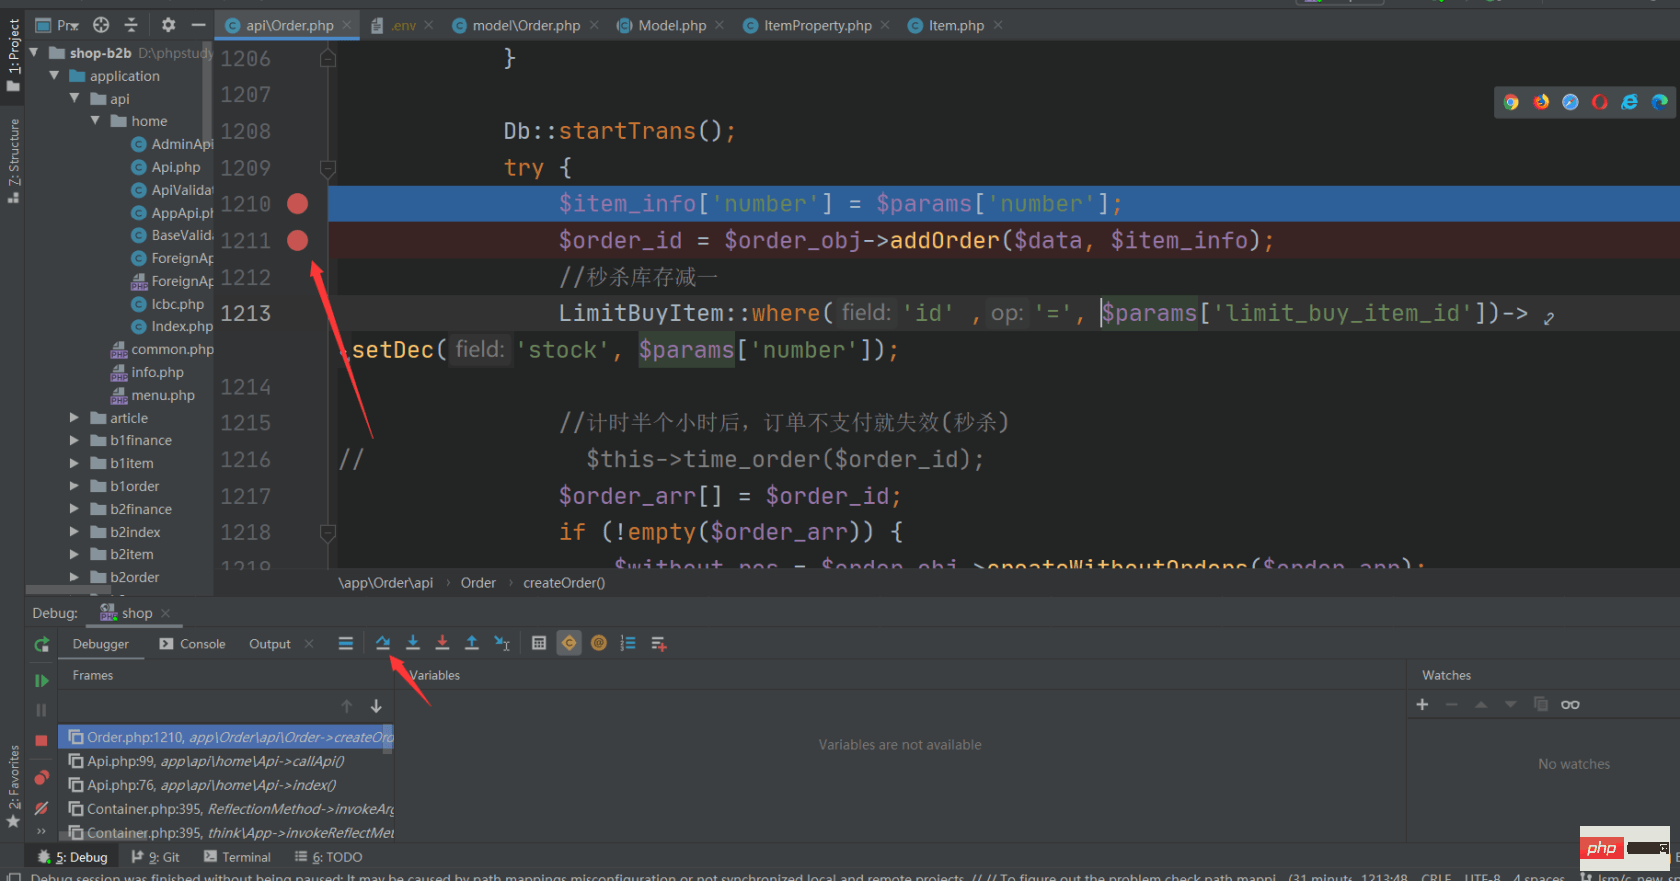
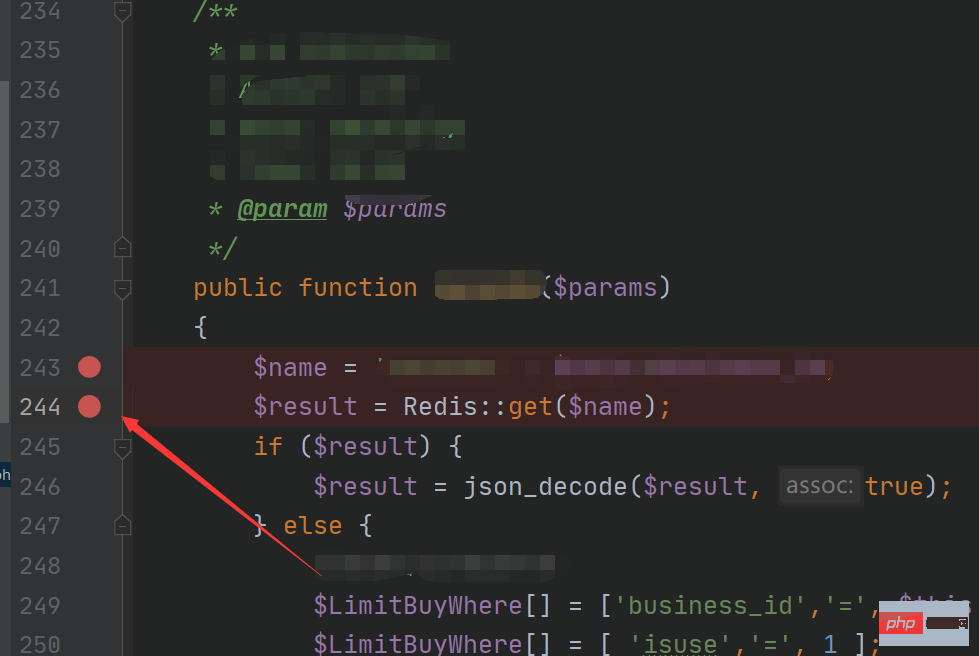
 At this time, phpstorm will automatically open the debug console, click the arrow to automatically next step, click the red dot on the left. Break point
What if you want to use postman? Bring this parameter over here
Add this pair of key-vlue to the parameters of postman, click send to automatically start debugging (postman will always be in the sending state until Breakpoint debugging completed)
-

- The tutorial I wrote hopes that readers can run xdebug in the shortest steps, and some details have been ignored. , interested students can go online to find more detailed configuration and instructions
(Of course not interested)
-
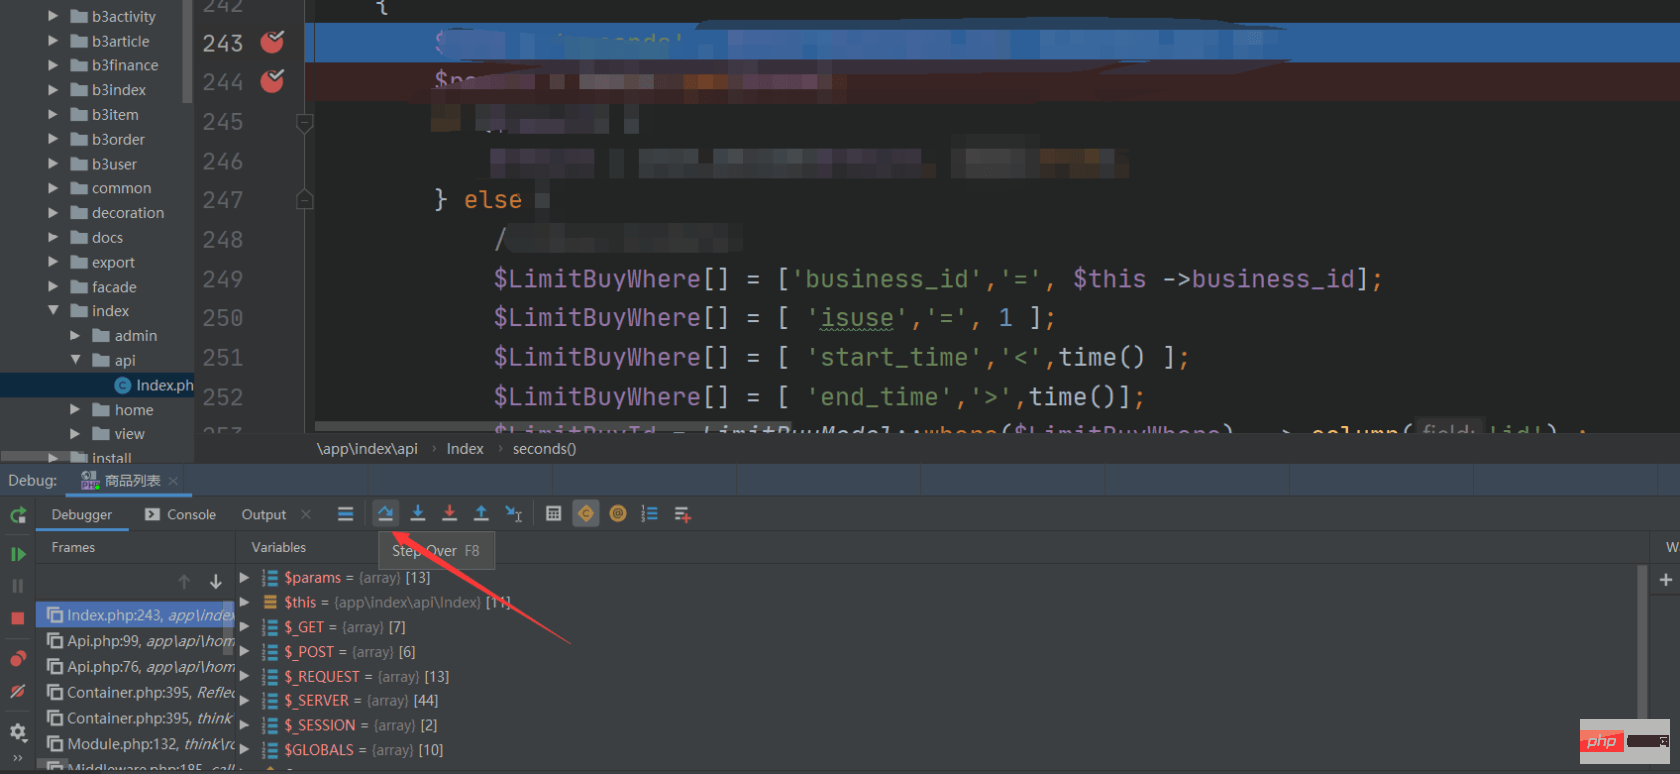
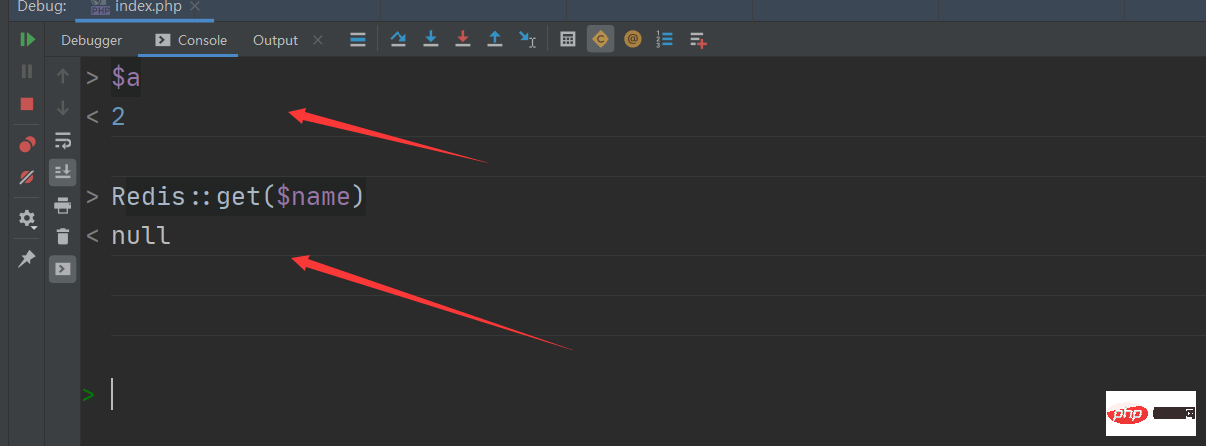
######debug console simple instructions#### #####You can break the point on the left. When the code is executed to the breakpoint, it will stop.############When you click this button, a line of code will be executed, but when it encounters a function, the entire code will be executed directly. Function############This button also executes a line of code, which can be executed inside the function###
- 跳到下一个断点

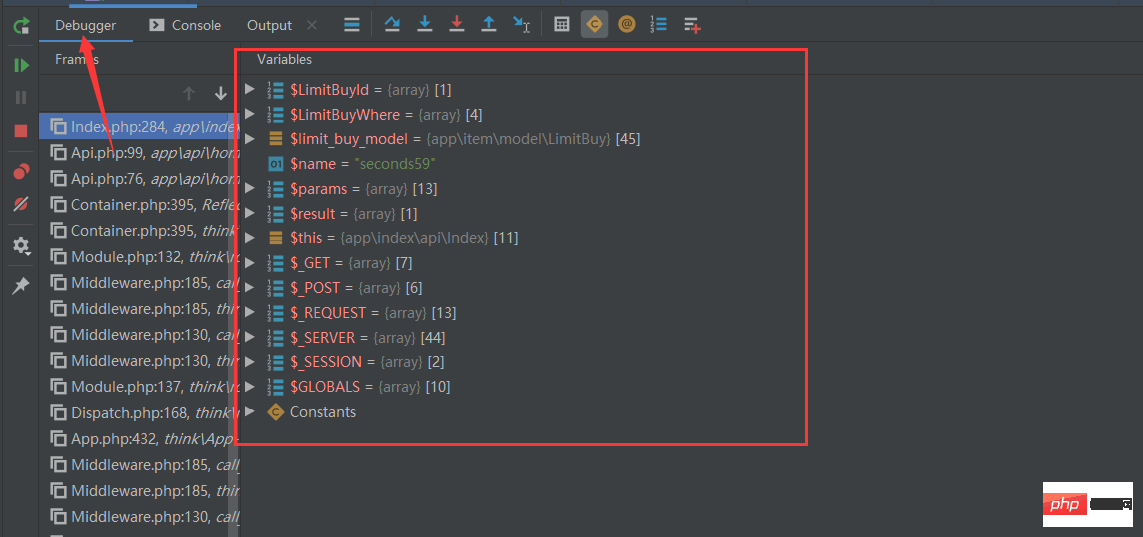
- 第一个页面可以很清晰的查看所有变量

- 第二个页面可以打印变量,甚至可以执行对象函数方法(贼有用)

- 第三个页面是查看输出

问题总结
- 断点调试时,PHP脚本执行超时后Apache自动断开连接,然后返回一个500错误
在apache的http.conf文件加入
FcgidIOTimeout 600
The above is the detailed content of How to use Xdebug to debug code in phpstorm. For more information, please follow other related articles on the PHP Chinese website!
Statement:
This article is reproduced at:learnku.com. If there is any infringement, please contact admin@php.cn delete
Previous article:How to configure Hyperf hot update development environment through PHPStormNext article:How to configure Hyperf hot update development environment through PHPStorm


