Excel linear fitting method
- 藏色散人Original
- 2020-02-15 10:50:2220897browse

Excel linear fitting method
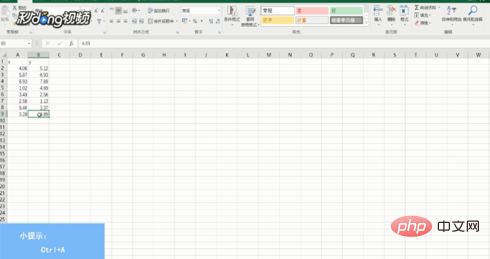
Select the sample data, ctrl A, click the "Insert" tab "Icon" item.
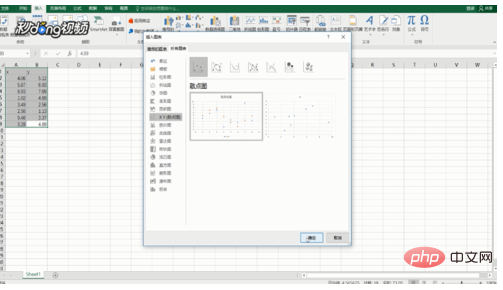
Select "XY Scatter Plot" and click "OK".
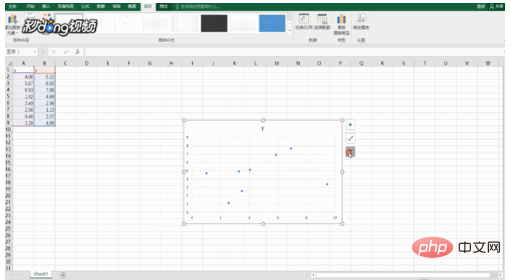
Select "Icon Filter" and click "Select Data".
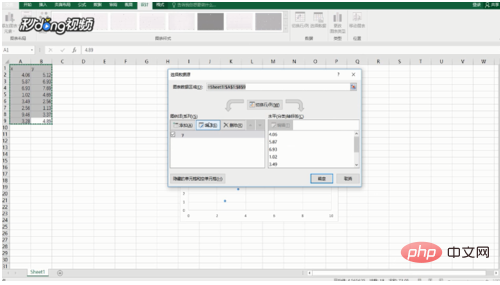
Click "Edit" after the series, enter the series name, select the series values of the X-axis and Y-axis according to the table content, and click "OK" twice.
Right-click on the scatter point and select "Add Trend Line".
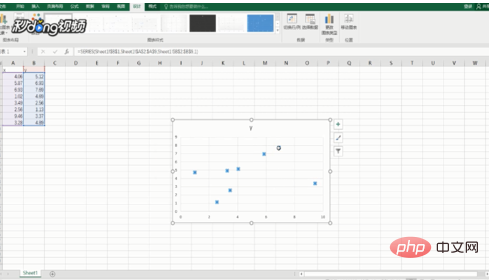
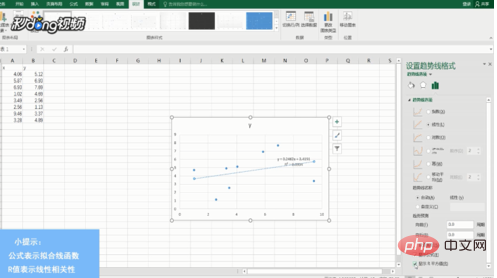
Select "Linear" in the trend line options, check "Show formula" and "Show R-squared value".
For more Excel-related technical articles, please visit the Excel Basic Tutorial column!
The above is the detailed content of Excel linear fitting method. For more information, please follow other related articles on the PHP Chinese website!
Statement:
The content of this article is voluntarily contributed by netizens, and the copyright belongs to the original author. This site does not assume corresponding legal responsibility. If you find any content suspected of plagiarism or infringement, please contact admin@php.cn
Previous article:What to do if the excel paper size cannot be setNext article:What to do if the excel paper size cannot be set

