Home >Backend Development >Python Tutorial >How to use subplot
How to use subplot
- 爱喝马黛茶的安东尼Original
- 2020-01-07 16:48:4211373browse

The function of subplot() in matlab is to create and control multiple graphic positions in the same screen.
Generally used format: subplot(m,n,p)
m——The number of lines, that is, create m rows of graphic positions on the same screen.
n——The number of columns, that is, create n columns of graphic positions on the same screen.
p——Number of digits, graphic position in m rows and n columns of the same screen.
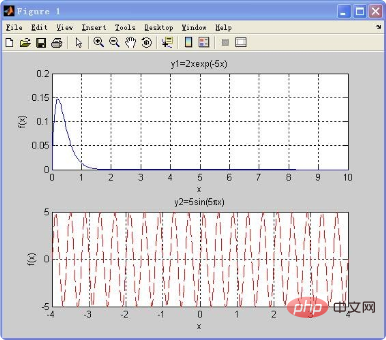
The following uses specific examples to illustrate the meaning of subplot().
x1=0:0.02:10;
y1=2*x1.*exp(-5*x1);
x2=-4:0.02:4;
y2=5*sin(5*pi*x2);
subplot(2,1,1)  %创建2行1列第一个图形
plot(x1,y1,'b-'),grid on
xlabel('x'),ylabel('f(x)');
title('y1=2xexp(-5x)')
subplot(2,1,2) %创建2行1列第二个图形
plot(x2,y2,'r--','LineWidth',1),grid on
xlabel('x'),ylabel('f(x)');
title('y2=5sin(5\pix)')

PHP Chinese website has a large number of free Python video tutorials, everyone is welcome to learn!
The above is the detailed content of How to use subplot. For more information, please follow other related articles on the PHP Chinese website!

