Home >Development Tools >phpstorm >PhpStorm Debug settings
PhpStorm Debug settings
- (*-*)浩Original
- 2020-01-03 14:17:004794browse

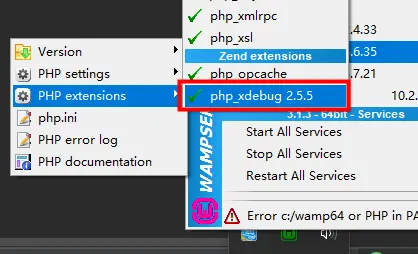
php environment opens xdebug ##Go to php.ini to view the xdebug configuration information
[xdebug]
zend_extension ="c:/wamp64/bin/php/php5.6.35/zend_ext/php_xdebug-2.5.5-5.6-vc11-x86_64.dll"
;xdebug.remote_enable = off
xdebug.profiler_enable = off
xdebug.profiler_enable_trigger = off
xdebug.profiler_output_name = cachegrind.out.%t.%p
xdebug.profiler_output_dir ="c:/wamp64/tmp"
xdebug.show_local_vars=0
xdebug.remote_autostart = 1    # 这里加上远程自动开启,可以省去在浏览器中加载xdebug插件的步骤

xdebug.idekey=phpstorm
xdebug.remote_enable = On
xdebug.remote_host=localhost
;xdebug.remote_port默认值为9000,这里需要跟phpstorm配置一致,下面有说明
xdebug.remote_port=9000
xdebug.remote_handler=dbgp
xdebug.auto_trace = On
PhpStorm configuration debug settings
Language & Frameworks > PHP > Debug (check the checkbox and remove it, the port defaults to 9000)
##Language & Frameworks > PHP > Debug > Servers (Add multiple Address that can be debugged)

The above is the detailed content of PhpStorm Debug settings. For more information, please follow other related articles on the PHP Chinese website!
Statement:
The content of this article is voluntarily contributed by netizens, and the copyright belongs to the original author. This site does not assume corresponding legal responsibility. If you find any content suspected of plagiarism or infringement, please contact admin@php.cn
Previous article:How to retrieve deleted files in phpstormNext article:How to retrieve deleted files in phpstorm

