Home >Backend Development >PHP Tutorial >PHP debugging tool: Installation and use of FirePHP
PHP debugging tool: Installation and use of FirePHP
- 藏色散人forward
- 2019-12-28 14:02:022991browse
Everyone who develops knows that we can use the browser console to debug JavaScript scripts, but for server-side scripts like PHP, do you know how to debug them? Today I recommend a PHP debugging tool to everyone, FirePHP!
Taking the Chrome browser as an example, the specific implementation steps are as follows:
1. Install the FirePHP plug-in
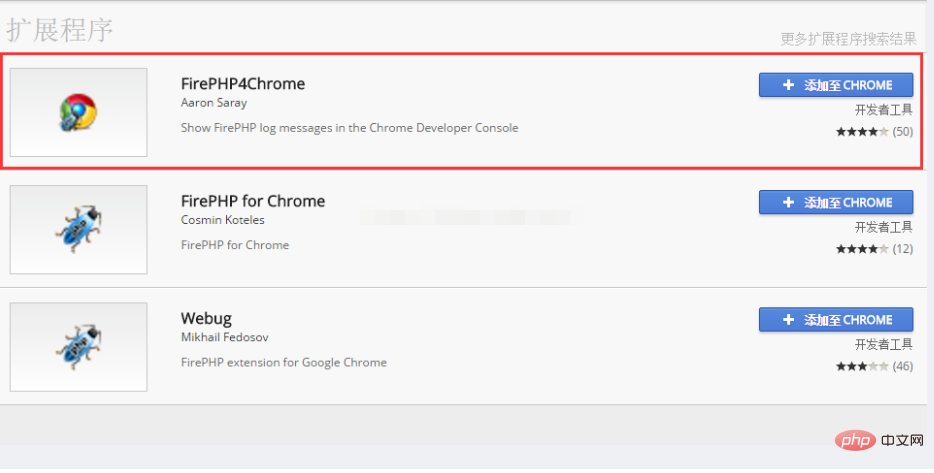
In the Chrome browser’s app store, Search for the firephp keyword, select the first one in the plug-in list that comes out, and add it to Chrome. As shown in the picture:
2. Obtain the FirePHP class library
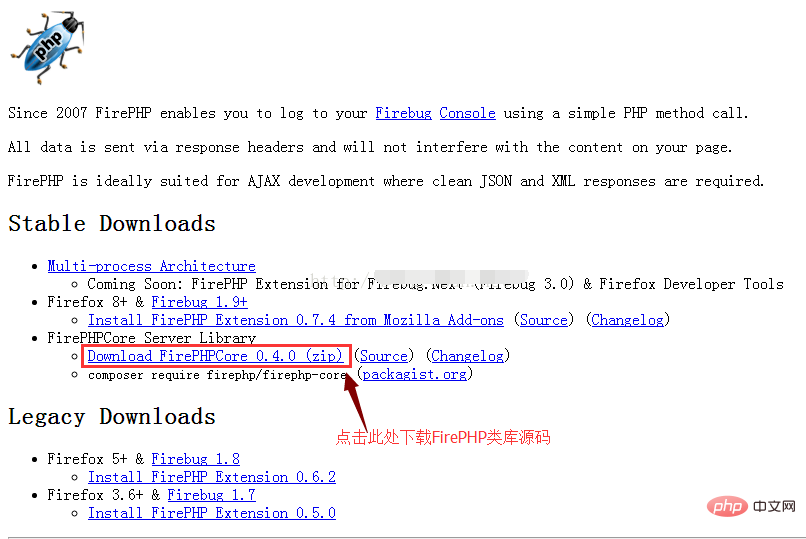
It is not enough to install the FirePHP browser plug-in, we also need to install its server side , FirePHP class library download address: http://www.firephp.org/, as shown in the figure:
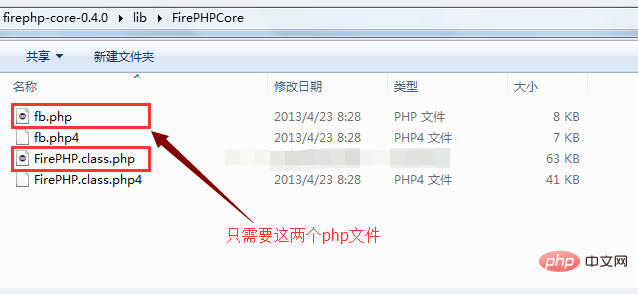
After the download is completed, compress fb.php and FirePHP in the package .class.php two files, copied to our project, as shown in the figure:
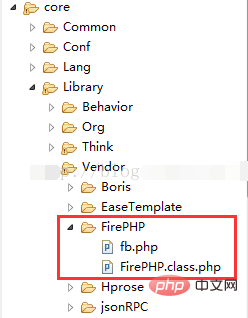
Since my development environment is ThinkPHP, I copied it to the Vendor of Library directory, as shown in the figure:
3. How to use
FirePHP’s plug-ins and class libraries have been installed. Let’s take a look at how to use them. it.
First, I wrote a FirePHP tool class, the content is as follows:
<?php
namespace Common\Lib\Util;
if (!class_exists('FB')) {
vendor('FirePHP.fb');
}
class FireBug {
/**
* 将php调试信息打印到控制台
* @param mixes $object : 待输出的数据,类型可以是字符串、数组或者对象
* @param string $label : 标题
* @param boolean $showTrace : 是否显示调用跟踪信息
*/
public static function console($object, $label=null, $showTrace=false){
//开发与生产模式的开关标识,我们只在开发模式下调试脚本
if (!DEBUG_PHP) {
return;
}
try {
$label = $label ? $label : time();
\FB::log($object,$label);
if (is_array($object) || is_object($object)) {
$headers = array_keys(reset($object));
if (is_array($headers)) {
array_unshift($object,$headers);
\FB::table($label,$object);
}else{
\FB::table($label,array(array_keys($object),$object));
}
}else if(is_object($object)){
\FB::table($label,$object);
}
if ($showTrace) {
\FB::trace($label);
}
} catch (Exception $e) {
echo '请开启输出缓冲函数ob_start()';
}
}
}
?>Then, call it where you need to debug, as follows:
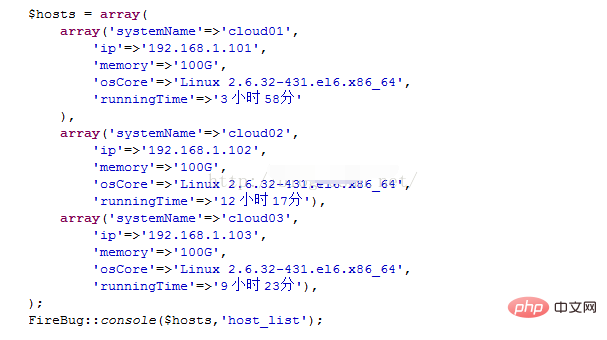
Open the console of the Chrome browser, we will see the following output:

Isn’t it very convenient, through FirePHP, we don’t need to debug The information is output in the form of echo, print_r or log, which virtually speeds up our development process.
The above is the detailed content of PHP debugging tool: Installation and use of FirePHP. For more information, please follow other related articles on the PHP Chinese website!

