How to debug vue with vscode?
Use VS Code breakpoint debugging
It is inconvenient to debug Vue code directly in the debugging window of Chrome. Fortunately, Visual Studio Code provides Debugger. for Chrome plug-in, you can debug the code directly in the VS Code breakpoint through configuration, and see the same value as the console in Chrome in the debugging window of VS Code. This article will introduce the configuration process.
Related recommendations: vscode tutorial
1. Open the Chrome remote debugging port
First we need to start Chrome with remote debugging turned on, so VS Code can be attached to Chrome.
Windows
Right-click the Chrome shortcut icon, select Properties
In the target column, add --remote-debugging-port=9222 at the end, pay attention to use Separate by spaces
macOS
Open the console
Execute the command /Applications/Google\ Chrome.app/Contents/MacOS/Google\ Chrome --remote-debugging-port =9222
Linux
Open the console
Execute the command google-chrome --remote-debugging-port=9222
2. Install the Chrome Debug plug-in
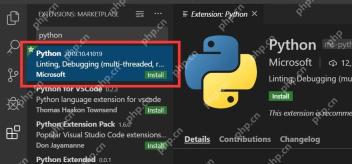
Click the extension button in the left sidebar of Visual Studio Code, then enter Debugger for Chrome in the search box and install the plug-in, enter it again, and click reload to restart after the installation is complete.

3. Create a Debug configuration file
Click the debug button in the left sidebar of Visual Studio Code, and click the settings pinion in the pop-up debugging configuration window. Then select chrome, VS Code will generate a .vscode directory in the root directory of the workspace. There will be a lanch.json file in it and it will be opened automatically.
Use the following configuration file to overwrite the contents of the automatically generated lanch.json file. .
Note: The port number in the URL must be consistent with the startup port number configured by WEBPACK.
{
  // Use IntelliSense to learn about possible attributes.
  // Hover to view descriptions of existing attributes.
  // For more information, visit: https://go.microsoft.com/fwlink/?linkid=830387
  "version": "0.2.0",
  "configurations": [
    {
      "type": "chrome",
      "request": "attach",
      "name": "Attach to Chrome",
      "port": 9222,
      "webRoot": "${workspaceRoot}/src",
      "url": "http://localhost:8080/#/",
      "sourceMaps": true,
      "sourceMapPathOverrides": {
        "webpack:///src/*": "${webRoot}/*"
      }
    }
  ]
}
4. Modify the webpack configuration
If it is a vue project packaged based on webpack, there may be a problem of breakpoint mismatch, and you still need to do something Modification:
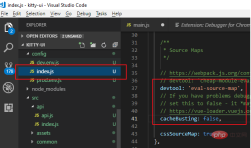
1. Open the index.js file in the config directory in the root directory
2. Change the devtool value under the dev node to 'eval-source-map'
3. Change the cacheBusting value under the dev node to false

5. Turn on debugging
After the above configuration is completed :
1. Open Chrome with remote debugging through the first step
2. Execute npm run dev in the vue project to start the project in debugging mode
3. Click the debug button in the left sidebar of VS Code, select Attach to Chrome and click the green start button. The debugging control bar will appear under normal circumstances.
Now you can debug breakpoints in the js code of the vue file.
The above is the detailed content of How to debug vue with vscode. For more information, please follow other related articles on the PHP Chinese website!
 Best Practices for Writing JavaScript Code with VSCodeMay 15, 2025 pm 09:45 PM
Best practices for writing JavaScript code in VSCode include: 1) Install Prettier, ESLint, and JavaScript (ES6) codesnippets extensions, 2) Configure launch.json files for debugging, and 3) Use modern JavaScript features and optimization loops to improve performance. With these settings and tricks, you can develop JavaScript code more efficiently in VSCode.
 Use VSCode to perform version fallback operation of codeMay 15, 2025 pm 09:42 PM
In VSCode, you can use Git for code version fallback. 1. Use gitreset--hardHEAD~1 to fall back to the previous version. 2. Use gitreset--hard to fall back to a specific commit. 3. Use gitrevert to safely fall back without changing history.
 Use tips and recommendations for the VSCode plug-in marketMay 15, 2025 pm 09:39 PM
To better utilize the VSCode plug-in market, first use advanced search functions to filter the plug-in, secondly install and uninstall the plug-in, and finally make full use of the plug-in functions and maintain them regularly. 1. Use keywords and advanced search functions (ratings, downloads, release dates) to filter plugins. 2. Click "Install" to install the plug-in, and click "Uninstall" to uninstall the plug-in. 3. It is recommended to use Prettier, GitLens and LiveShare plugins, and regularly review and update the plugins to optimize performance.
 An effective way to resolve Git commit conflicts in VSCodeMay 15, 2025 pm 09:36 PM
Handling Git commit conflicts in VSCode can be effectively resolved through the following steps: 1. Identify the conflicting file, and VSCode will be highlighted in red. 2. Manually edit the code between conflict marks and decide to retain, delete or merge. 3. Keep branches small and focused to reduce conflicts. 4. Use GitLens extension to understand code history. 5. Use VSCode to build-in Git commands, such as gitmerge--abort or gitreset--hard. 6. Avoid relying on automatic merge tools and carefully check the merge results. 7. Delete all conflict marks to avoid compilation errors. With these methods and tricks, you can handle Git conflicts efficiently in VSCode.
 How to manually install plugin packages in VSCodeMay 15, 2025 pm 09:33 PM
The steps to manually install the plug-in package in VSCode are: 1. Download the .vsix file of the plug-in; 2. Open VSCode and press Ctrl Shift P (Windows/Linux) or Cmd Shift P (Mac) to call up the command panel; 3. Enter and select Extensions:InstallfromVSIX..., then select .vsix file and install. Manually installing plug-ins provides a flexible way to install, especially when the network is restricted or the plug-in market is unavailable, but attention needs to be paid to file security and possible dependencies.
 Environment configuration for running Ruby code in VSCodeMay 15, 2025 pm 09:30 PM
Configuring the Ruby development environment in VSCode requires the following steps: 1. Install Ruby: Download and install from the official website or using RubyInstaller. 2. Install the plug-in: Install CodeRunner and Ruby plug-ins in VSCode. 3. Set up the debugging environment: Install the DebuggerforRuby plug-in and create a launch.json file in the .vscode folder for configuration. This way, you can write, run, and debug Ruby code efficiently in VSCode.
 Efficient way to install VSCode plug-in in batchesMay 15, 2025 pm 09:27 PM
An efficient way to install VSCode plugins in batches is to use command line tools. The specific steps include: 1. Export the plug-in list: run code--list-extensions>extensions.txt. 2. Bulk installation of plug-ins: Run catextensions.txt|xargs-n1code--install-extension, so that plug-in configurations can be easily synchronized between different environments.
 View Git history and changes in VSCodeMay 15, 2025 pm 09:24 PM
How to view Git history and changes in VSCode include: 1. Open VSCode and make sure the project has initialized the Git repository. 2. Click the "Source Code Management" icon in the left sidebar. 3. Select "...(more options)" and click "Git:ShowGitOutput". 4. View commit history and file changes. 5. Right-click the file and select "Git:ShowFileHistory" to view the file change history. Through these steps, you can efficiently view Git history and changes in VSCode to improve development efficiency.


Hot AI Tools

Undresser.AI Undress
AI-powered app for creating realistic nude photos

AI Clothes Remover
Online AI tool for removing clothes from photos.

Undress AI Tool
Undress images for free

Clothoff.io
AI clothes remover

Video Face Swap
Swap faces in any video effortlessly with our completely free AI face swap tool!

Hot Article

Hot Tools

Dreamweaver CS6
Visual web development tools

ZendStudio 13.5.1 Mac
Powerful PHP integrated development environment

SublimeText3 Linux new version
SublimeText3 Linux latest version

Safe Exam Browser
Safe Exam Browser is a secure browser environment for taking online exams securely. This software turns any computer into a secure workstation. It controls access to any utility and prevents students from using unauthorized resources.

VSCode Windows 64-bit Download
A free and powerful IDE editor launched by Microsoft


