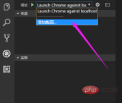
First install the extended debugging plug-indebugger for chrome

Click the ladybug button to debug the project Configuration, click the configuration button

Select the Chrome environment


The above is the detailed content of How to debug code with vscode. For more information, please follow other related articles on the PHP Chinese website!
 Visual Studio Professional and Enterprise: Paid Versions and FeaturesMay 10, 2025 am 12:20 AM
The difference between VisualStudioProfessional and Enterprise is in the functionality and target user groups. The Professional version is suitable for professional developers and provides functions such as code analysis; the Enterprise version is for large teams and has added advanced tools such as test management.
 Choosing Between Visual Studio and VS Code: The Right Tool for YouMay 09, 2025 am 12:21 AM
VisualStudio is suitable for large projects, VSCode is suitable for projects of all sizes. 1. VisualStudio provides comprehensive IDE functions, supports multiple languages, integrated debugging and testing tools. 2.VSCode is a lightweight editor that supports multiple languages through extension, has a simple interface and fast startup.
 Visual Studio: A Powerful Tool for DevelopersMay 08, 2025 am 12:19 AM
VisualStudio is a powerful IDE developed by Microsoft, supporting multiple programming languages and platforms. Its core advantages include: 1. Intelligent code prompts and debugging functions, 2. Integrated development, debugging, testing and version control, 3. Extended functions through plug-ins, 4. Provide performance optimization and best practice tools to help developers improve efficiency and code quality.
 Visual Studio vs. VS Code: Pricing, Licensing, and AvailabilityMay 07, 2025 am 12:11 AM
The differences in pricing, licensing and availability of VisualStudio and VSCode are as follows: 1. Pricing: VSCode is completely free, while VisualStudio offers free community and paid enterprise versions. 2. License: VSCode uses a flexible MIT license, and the license of VisualStudio varies according to the version. 3. Usability: VSCode is supported across platforms, while VisualStudio performs best on Windows.
 Visual Studio: From Code to ProductionMay 06, 2025 am 12:10 AM
VisualStudio supports the entire process from code writing to production deployment. 1) Code writing: Provides intelligent code completion and reconstruction functions. 2) Debugging and testing: Integrate powerful debugging tools and unit testing framework. 3) Version control: seamlessly integrate with Git to simplify code management. 4) Deployment and Release: Supports multiple deployment options to simplify the application release process.
 Visual Studio: A Look at the Licensing LandscapeMay 05, 2025 am 12:17 AM
VisualStudio offers three license types: Community, Professional and Enterprise. The Community Edition is free, suitable for individual developers and small teams; the Professional Edition is annually subscribed, suitable for professional developers who need more functions; the Enterprise Edition is the highest price, suitable for large teams and enterprises. When selecting a license, project size, budget and teamwork needs should be considered.
 The Ultimate Showdown: Visual Studio vs. VS CodeMay 04, 2025 am 12:01 AM
VisualStudio is suitable for large-scale project development, while VSCode is suitable for projects of all sizes. 1. VisualStudio provides comprehensive development tools, such as integrated debugger, version control and testing tools. 2.VSCode is known for its scalability, cross-platform and fast launch, and is suitable for fast editing and small project development.
 Visual Studio vs. VS Code: Comparing the Two IDEsMay 03, 2025 am 12:04 AM
VisualStudio is suitable for large projects and Windows development, while VSCode is suitable for cross-platform and small projects. 1. VisualStudio provides a full-featured IDE, supports .NET framework and powerful debugging tools. 2.VSCode is a lightweight editor that emphasizes flexibility and extensibility, and is suitable for various development scenarios.


Hot AI Tools

Undresser.AI Undress
AI-powered app for creating realistic nude photos

AI Clothes Remover
Online AI tool for removing clothes from photos.

Undress AI Tool
Undress images for free

Clothoff.io
AI clothes remover

Video Face Swap
Swap faces in any video effortlessly with our completely free AI face swap tool!

Hot Article

Hot Tools

WebStorm Mac version
Useful JavaScript development tools

SublimeText3 Linux new version
SublimeText3 Linux latest version

SublimeText3 Mac version
God-level code editing software (SublimeText3)

Atom editor mac version download
The most popular open source editor

Dreamweaver CS6
Visual web development tools


