What is excel trend line
- 藏色散人Original
- 2019-11-05 16:20:4611106browse

What is excel trend line?
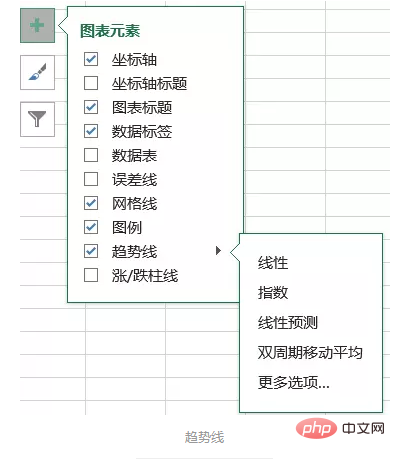
When using Excel, a trend line will be used,
Recommended tutorial: excel tutorial

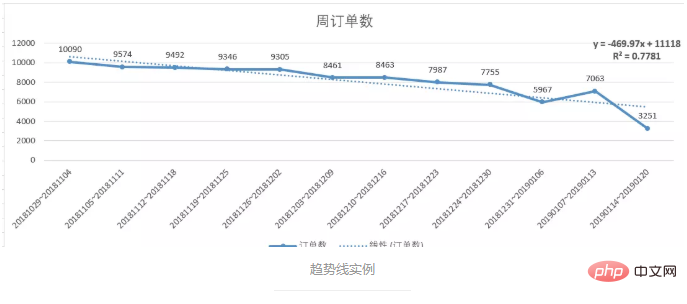
It is the above thing. It represents a trend of data and can be used to analyze prediction problems, similar to regression analysis.

After adding a trend line, we can display the value. After adding it, we will want to know whether the trend is reliable, which means whether the trend is reliable or not.
A trendline is most reliable when its R-squared value is at or near 1. The R-squared value also becomes the coefficient of determination.
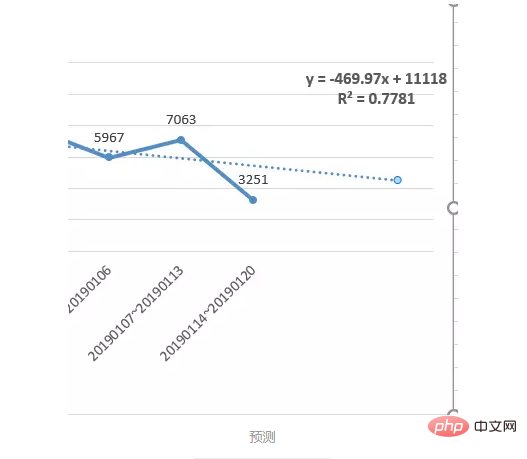
This trend line can be used to judge the correlation of data, and can also be used for prediction. The trend line can be moved downward for several periods, and the data can be prejudged.

Normally speaking, if we do regression analysis ourselves, the R-squared value should be the same. I will come back to verify this after I learn the code.
The above is the detailed content of What is excel trend line. For more information, please follow other related articles on the PHP Chinese website!

