How to implement query optimization in navicat
- 爱喝马黛茶的安东尼Original
- 2019-08-20 16:11:115549browse

Navicat Monitor is a secure, simple and agentless remote server monitoring tool. It has powerful functions to maximize your monitoring. Monitored servers include MySQL, MariaDB, and Percona Server, and are compatible with cloud databases such as Amazon RDS, Amazon Aurora, Oracle Cloud, Microsoft Azure, and Alibaba Cloud. Navicat Monitor is a server-based software that can be accessed from anywhere using a web browser. With network access, you can easily and seamlessly monitor the status of global servers around the clock.
One of the main complaints database administrators (DBAs) have about general and slow query logs is that their contents are difficult to read. The solution is to use navicat monitor for mysql/mariadb logs. Its Query Analyzer tool provides a graphical representation of query logs, enabling you to monitor and optimize query performance, visualize query activity statistics, analyze SQL statements, and quickly identify and resolve long-running queries.
Related recommendations: "Navicat for mysql tutorial"
Query Analyzer
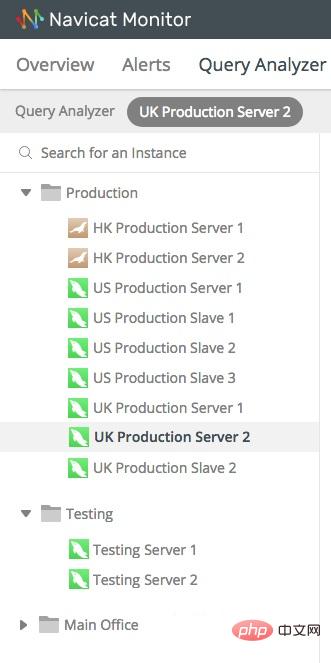
To start using Query Analyzer, please click on the left pane to select the instance you want to analyze:

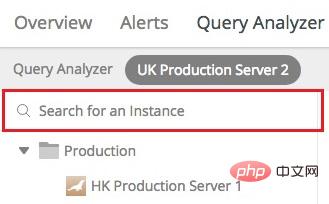
You can also narrow the list to the instance you are looking for by entering a name in the search field:

After selecting an instance, analysis starts immediately. After a short time, the analysis results will be displayed:

The screen is divided into the following parts:
·Latest Deadlock Query: Display the selected Transaction information of the latest Deadlocks detected in the instance.
·Process List: Displays the total number of processes running on the selected instance, and lists the last 5 processes, including ID, command type, user, database and time information.
·Query Analyzer: Displays information about query statements with customizable and sortable columns.
Latest Deadlock Query
If you want to see more than just the latest deadlock, you can click the View All button. This will open the Deadlock page. It displays all deadlocks detected on the selected instance:

All monitored instances are displayed in the left pane. Selecting an instance causes Deadlocks for that instance. You can filter the list by providing a value in the "Search for a deadlock" text box.
By default, the Deadlocks list is automatically refreshed every 5 seconds. The auto-refresh time can be changed using the "Refresh Time" drop-down menu. To pause automatic refresh, click the pause button:

You can also set the number of rows to display via the "Rows to Display" drop-down menu.
Process Table
You can click View All to view all processes.
The "Process List" page displays all processes currently running on the selected instance. You can check the currently executing query. The process list provides the following details:
(1) ID: Thread ID.
(2) User@Host: The user who issued the statement.
(3) DB: The database currently used by the user.
(4) Command: The type of command issued by the user.
(5) Time: The time (seconds) the thread is in the current state.
(6) State: Indicates the status of the operation being performed by the thread.
(7) Info: Statement issued by the user.
Like Deadlocks, all monitored instances are displayed in the left pane, where you can select an instance to display its process list. Like Deadlocks, the process list is automatically refreshed every 5 seconds. It also includes a refresh time drop-down menu to change the auto-refresh time. Click the Pause button to pause automatic refresh.
The thread list can be filtered and sorted. Simply enter a search string in the search thread box to filter the list, then click on a column name to sort the list. Additionally, clicking on a row to display and selecting a predefined number changes the number of threads displayed per page.
Kill the process
In addition to displaying the currently running process, you can also stop the thread immediately by clicking the "Action" column and then clicking "End Process" in the pop-up dialog box:
The above is the detailed content of How to implement query optimization in navicat. For more information, please follow other related articles on the PHP Chinese website!


