


Simply speaking, there are two ways. One is source code debugging, which is to analyze the source code to find the bug location. Generally, printf() is used to print out the information of each step of program execution. The other is To debug executable files, you need to use a debugger.
1. Source code debug

is similar to the source code below. It mainly uses the information output when the program is executed to locate the location of the bug, and then modify it. Source code.
#include <stdio.h>
void f() { ; }
int main()
{
#ifdef _DEBUG
    printf("start main function!\n");
#endif
    void f();
#ifdef _DEBUG
    printf("leave main function !\n");
#endif
    return 0;
}
Another case of using debug in C language
# 在代码中写入
#ifdef  DEBUG
#endif
# 编译时用 gcc –DDEBUG –g –o ***  ***.c  此时运行的结果是有debug信息的 ,gcc –o ***  ***.c  无debug 信息 ,如
# include <stdio.h>
int main ()
{    int i=0 ;
    while (1) {
  printf ("hello world\t") ;
        i++ ;
    printf ("time=%d\n",i);
#ifdef DEBUG
     if (i>10)
         break ;
#endif
    }
       return 0 ;
 }
Open debug: gcc -DDEBUG -o debug debug.c
No need to debug (infinite loop): gcc - o debug debug.c
2. For executable file debugging, the commonly used debugging on the Windows platform is the debugging that comes with vs/vc. The other is the debugger windbg developed by Microsoft. gdb is commonly used on Linux platforms.
The debugger that comes with the IDE takes VC6.0 as an example. After writing the code, press F11 on the shortcut keyboard to enter debugging. At this time, right-click and select "go to disassembly" to view the program. disassembly code. Generally, in this case, it is mainly for learning disassembly of C language.

Windbg has many functions. It can debug source code, debug executable files, kernel debugging, and debug dump files. The more you use it, the more natural it will be. Familiar, to debug an executable file, just click "File", select "Open Executeable" in the pop-up dialog box, and then find the program you want to debug.

The Gdb debugger is commonly used in Linux. It is worth noting that to use gdb debugging, when using gcc or g to compile C/c files, you need to add the -g parameter. Only then can the symbol table be generated. The picture below is a screenshot of using gdb to analyze the distribution of variables in C. Let’s take a general look at what it looks like. You will become familiar with it after using it a lot, and you don’t need to learn it.

The above is the detailed content of How to use debug in c language. For more information, please follow other related articles on the PHP Chinese website!

 C语言中的常量是什么,可以举一个例子吗?Aug 28, 2023 pm 10:45 PM
常量也称为变量,一旦定义,其值在程序执行期间就不会改变。因此,我们可以将变量声明为引用固定值的常量。它也被称为文字。必须使用Const关键字来定义常量。语法C编程语言中使用的常量语法如下-consttypeVariableName;(or)consttype*VariableName;不同类型的常量在C编程语言中使用的不同类型的常量如下所示:整数常量-例如:1,0,34,4567浮点数常量-例如:0.0,156.89,23.456八进制和十六进制常量-例如:十六进制:0x2a,0xaa..八进制
 VSCode和VS C++IntelliSense无法工作或拾取库Feb 29, 2024 pm 01:28 PM
VS代码和VisualStudioC++IntelliSense可能无法拾取库,尤其是在处理大型项目时。当我们将鼠标悬停在#Include<;wx/wx.h>;上时,我们看到了错误消息“CannotOpen源文件‘string.h’”(依赖于“wx/wx.h”),有时,自动完成功能无法响应。在这篇文章中,我们将看到如果VSCode和VSC++IntelliSense不能工作或不能提取库,你可以做些什么。为什么我的智能感知不能在C++中工作?处理大文件时,IntelliSense有时
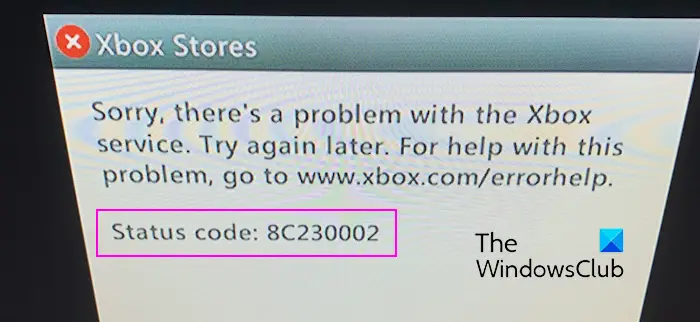 修复Xbox错误代码8C230002Feb 27, 2024 pm 03:55 PM
您是否由于错误代码8C230002而无法在Xbox上购买或观看内容?一些用户在尝试购买或在其控制台上观看内容时不断收到此错误。抱歉,Xbox服务出现问题。稍后再试.有关此问题的帮助,请访问www.xbox.com/errorhelp。状态代码:8C230002这种错误代码通常是由于暂时的服务器或网络问题引起的。但是,还有可能是由于帐户的隐私设置或家长控制等其他原因,这些可能会阻止您购买或观看特定内容。修复Xbox错误代码8C230002如果您尝试在Xbox控制台上观看或购买内容时收到错误代码8C
 递归程序在C++中找到数组的最小和最大元素Aug 31, 2023 pm 07:37 PM
我们以整数数组Arr[]作为输入。目标是使用递归方法在数组中找到最大和最小的元素。由于我们使用递归,我们将遍历整个数组,直到达到长度=1,然后返回A[0],这形成了基本情况。否则,将当前元素与当前最小或最大值进行比较,并通过递归更新其值以供后续元素使用。让我们看看这个的各种输入输出场景−输入 −Arr={12,67,99,76,32};输出 −数组中的最大值:99解释 &mi
 中国东方航空宣布C919客机即将投入实际运营May 28, 2023 pm 11:43 PM
5月25日消息,中国东方航空在业绩说明会上披露了关于C919客机的最新进展。据公司表示,与中国商飞签署的C919采购协议已于2021年3月正式生效,其中首架C919飞机已在2022年底交付。预计不久之后,该飞机将正式投入实际运营。东方航空将以上海为主要基地进行C919的商业运营,并计划在2022年和2023年引进总共5架C919客机。公司表示,未来的引进计划将根据实际运营情况和航线网络规划来确定。据小编了解,C919是中国具有完全自主知识产权的全球新一代单通道干线客机,符合国际通行的适航标准。该
 C++程序打印数字的螺旋图案Sep 05, 2023 pm 06:25 PM
以不同格式显示数字是学习基本编码问题之一。不同的编码概念,如条件语句和循环语句。有不同的程序中,我们使用特殊字符(如星号)来打印三角形或正方形。在本文中,我们将以螺旋形式打印数字,就像C++中的正方形一样。我们将行数n作为输入,然后从左上角开始移向右侧,然后向下,然后向左,然后向上,然后再次向右,以此类推等等。螺旋图案与数字123456724252627282982340414243309223948494431102138474645321120373635343312191817161514
 C语言中的void关键字的作用Feb 19, 2024 pm 11:33 PM
C中的void是一个特殊的关键字,用来表示空类型,也就是指没有具体类型的数据。在C语言中,void通常用于以下三个方面。函数返回类型为void在C语言中,函数可以有不同的返回类型,例如int、float、char等。然而,如果函数不返回任何值,则可以将返回类型设为void。这意味着函数执行完毕后,并不返回具体的数值。例如:voidhelloWorld()
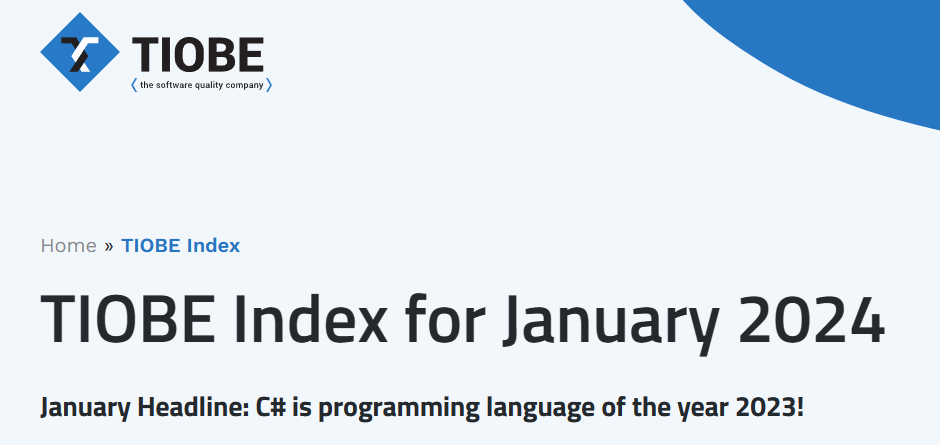 23 年来首次,C# 获得了 TIOBE 2023 年度编程语言奖Jan 11, 2024 pm 04:45 PM
根据TIOBE编程社区指数,该指数是衡量编程语言受欢迎程度的标准之一,通过收集来自全球工程师、课程、供应商和搜索引擎的数据进行评估。2024年1月TIOBE指数于近日发布,同时官方公布了2023年编程语言排名,C#荣获TIOBE2023年度编程语言,这是23年来C#首次拿下这一荣誉。TIOBE官方新闻稿称,C#已经稳居前10名长达20多年,如今它正在追赶四大语言,成为一年内涨幅最大的编程语言(+1.43%),当之无愧地获得了该奖项。排名第二的是Scratch(+0.83%)和Fortran(+0

Hot AI Tools

Undresser.AI Undress
AI-powered app for creating realistic nude photos

AI Clothes Remover
Online AI tool for removing clothes from photos.

Undress AI Tool
Undress images for free

Clothoff.io
AI clothes remover

AI Hentai Generator
Generate AI Hentai for free.

Hot Article
Hot Tools

SublimeText3 Mac version
God-level code editing software (SublimeText3)

SAP NetWeaver Server Adapter for Eclipse
Integrate Eclipse with SAP NetWeaver application server.

Atom editor mac version download
The most popular open source editor

mPDF
mPDF is a PHP library that can generate PDF files from UTF-8 encoded HTML. The original author, Ian Back, wrote mPDF to output PDF files "on the fly" from his website and handle different languages. It is slower than original scripts like HTML2FPDF and produces larger files when using Unicode fonts, but supports CSS styles etc. and has a lot of enhancements. Supports almost all languages, including RTL (Arabic and Hebrew) and CJK (Chinese, Japanese and Korean). Supports nested block-level elements (such as P, DIV),

SecLists
SecLists is the ultimate security tester's companion. It is a collection of various types of lists that are frequently used during security assessments, all in one place. SecLists helps make security testing more efficient and productive by conveniently providing all the lists a security tester might need. List types include usernames, passwords, URLs, fuzzing payloads, sensitive data patterns, web shells, and more. The tester can simply pull this repository onto a new test machine and he will have access to every type of list he needs.

