
Home >Java >javaTutorial >Analysis of JVM memory area and garbage collection (picture and text)
Analysis of JVM memory area and garbage collection (picture and text)

- 不言forward
- 2019-01-24 11:09:324785browse
The content of this article is about the analysis of JVM memory area and garbage collection (pictures and texts). It has certain reference value. Friends in need can refer to it. I hope it will be helpful to you.
1. Introduction to JVM
JVM, the full name is Java Virtual Machine, which is Java virtual machine. Applications written in Java as a programming language run on the JVM. JVM is a specification for computing devices. It is a fictional computer that is implemented by simulating various computer functions on an actual computer. A very important feature of Java is its independence from the platform, and the JVM is the key to realizing this feature.
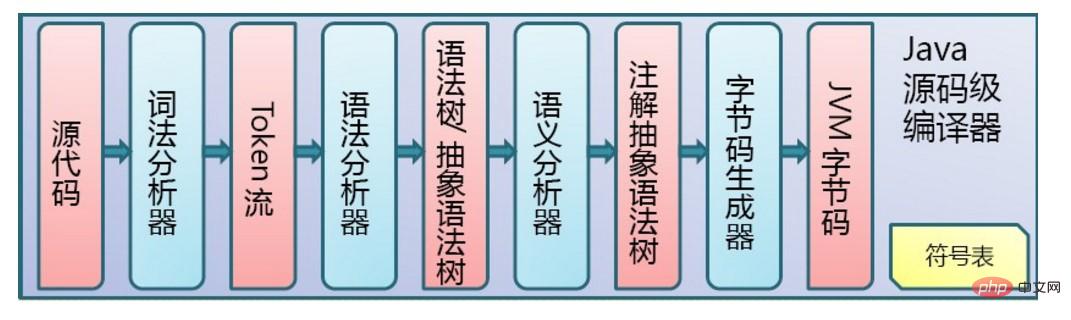
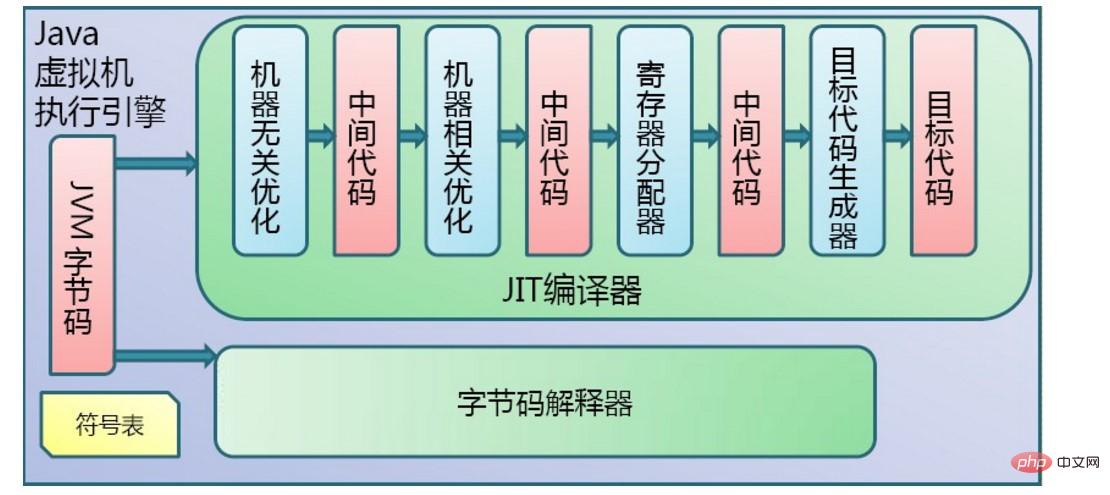
The execution of the program by the JVM is mainly divided into two steps. The first step is compilation, that is, the .java source file is compiled into a .class bytecode file. The second step is interpretation. The JVM interprets the bytes code file for interpretation and execution. The two step flow charts are shown in the following two figures respectively:
2. JVM memory area
The entire JVM system is divided into two subsystems. The first one is ClassLoader, which is the class loader. Its function is to load the written class into the JVM. The second is the Execution Engine, which is the execution engine, responsible for interpreting and executing the compiled bytecode files. The Execution Engine mentioned above is divided into two parts. The first part is the Runtime data area, which is the runtime data area, which is equivalent to the memory in the JVM. The second part is the Native interface, which is the localization interface, which is mainly used to execute other non-Java programs. A program written in a programming language.
The key point is the former Runtime data area, which is divided into five parts, namely Method area (method area), Heap (heap), VM stack (virtual machine stack), Program counter register (program counter), Native method stack. The first two threads are shared, and the latter three threads are isolated. As shown in the figure below:
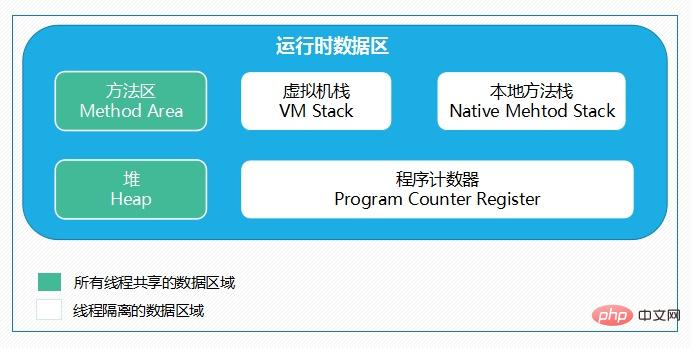
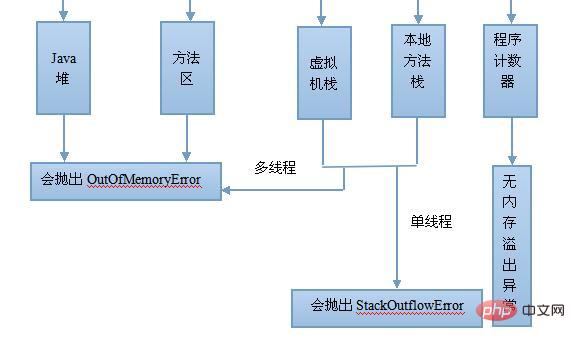
In summary, the JVM will allocate the Method area (method area) and Heap (heap) when it is initially run. Every time the JVM encounters a thread, it allocates Program counter (program counter), VM stack (virtual machine stack), and Native method stack (local method stack). When the thread terminates, the three (virtual machine stack, local method stack) The memory space occupied by the method stack and program counter) will also be released. This is also the reason why the data area is divided into thread sharing and thread isolation. The life cycle of the three thread isolated areas is the same as that of the thread to which it belongs, and the thread shared area is the same as the life cycle of the Java program running, so this is also system garbage. The reason why recycling occurs only in the thread-shared area (actually, for most virtual machines, it occurs on the Heap). Regarding the memory overflow exception, the following figure shows:
1. Method area
The method area includes constant pool and static fields. Stores the information of the loaded class (name, modifiers, etc.), static variables of the class, constants of the class, Field information of the class, and method information of the class. When developers obtain information in the program through methods such as getName and isInterface in the Class object, these data come from the method area.
2. Heap (Heap)
The heap is the largest piece of memory managed by the JVM. Almost all object instances and arrays are in this area. It can be considered that all objects created by new in Java are The memory of objects is allocated here, and the memory of objects in the heap needs to wait for GC to be recycled.
3. Program counter register (program counter)
The program counter is a small memory space. It is the line number indicator of the bytecode executed by the current thread. The bytecode When the interpreter is working, it selects the next bytecode instruction to be executed by changing the value of the counter. Basic functions such as branches, jumps, and loops all rely on it to implement.
4. VM stack (Virtual Machine Stack)
The virtual machine stack describes the memory model of Java method execution. Each method will create a stack frame (Stack Frame) when executed. The stack frame is used to store local variable tables (basic data types, object references, etc.), operand stacks, dynamic links, method return addresses and some additional additional information.
5. Native method stack
This area plays a very similar role to the virtual machine stack, except that the virtual machine stack serves the virtual machine to execute Java methods, and the local method The stack serves the native operating system (Native) methods used.
3. JVM garbage collection
The GenerationalCollecting (garbage collection) principle of JVM is to divide objects into young generation (Young), old generation (Tenured), and persistent generation (Perm), and use different algorithms for objects with different life cycles.
Usually JVM memory recycling always refers to Heap (heap) memory recycling. Indeed, only the content in the Heap (heap) is dynamically allocated, so the young generation and old generation of the above objects both refer to the JVM. Heap (heap) space, and the persistent generation is the Method area (method area) mentioned before, which does not belong to the Heap (heap).
1. Young Generation
When a Java application allocates Java objects, these objects will be allocated to the young generation heap space
This space is mostly small objects and will be recycled frequently
Since the garbage collection of the young generation heap space will be very frequent, its garbage collection algorithm will pay more attention to recycling efficiency
2 . Old generation
The long-lived objects in the young generation heap space will be transferred (perhaps permanently) to the old generation heap space
This heap space is usually larger than The heap space of the young generation is large, and its space growth rate is slow
Since most of the JVM heap space is allocated to the old generation, its garbage collection algorithm needs to be more space-saving, and this algorithm needs to be able to handle low Garbage-density heap space
3. The persistent generation
stores the metadata of VM and Java classes, as well as the static of interned strings and classes Variable
When the heap space of these three generations is tight or there is not enough space to allocate for new requests, the garbage collection mechanism will take effect. There are two types of garbage collection: Minor GC and Full GC. When the young generation heap space is full, a collection will be triggered to move surviving objects to the old generation heap space. When the old generation heap space is full, a full collection covering the entire range of the object heap will be triggered.
This is a brief analysis of JVM memory area and garbage collection, for reference only.
The above is the detailed content of Analysis of JVM memory area and garbage collection (picture and text). For more information, please follow other related articles on the PHP Chinese website!