Home >Java >javaTutorial >Use JDK's tool jstack to find out the cause of runtime program deadlock
Use JDK's tool jstack to find out the cause of runtime program deadlock
- 不言forward
- 2018-10-24 11:06:282280browse
The content of this article is about using the JDK tool jstack to find out the causes of runtime program deadlocks. It has certain reference value. Friends in need can refer to it. I hope it will be helpful to you.
Java multi-threaded programming is also something that is often examined in Java interviews. Friends who are new to Java multi-threaded programming may accidentally write some applications that can cause deadlocks. How to analyze the causes of Java multi-threading? Many times we set breakpoints and single-step debugging on statements that are suspected of causing deadlock, but they cannot be reproduced. This phenomenon is normal, because the timing of code execution is different between single-step debugging and direct running of the program, and the triggering conditions for deadlock may not be met.

In fact, JDK has provided Java programmers with powerful deadlock analysis tools that can directly analyze a running and deadlocked program. State application, and give the specific line of Java code that caused the deadlock.
This article uses an example to demonstrate how to use the standard tools provided by the JDK.
This tool is called jstack, which is an executable file in the bin folder of the JDK installation directory.
We first write an application that will cause deadlock.
public class DeadLockExample {
    public static void main(String[] args) {
        final String resource1 = "ABAP";
        final String resource2 = "Java";
        Thread t1 = new Thread() {
            public void run() {
                synchronized (resource1) {
                    System.out.println("Thread 1: locked resource 1");
                    try {
                        Thread.sleep(100);
                    }
                    catch (Exception e) {
                    }
                    synchronized (resource2) {
                        System.out.println("Thread 1: locked resource 2");
                    }
                }
            }
        }
        ;
        Thread t2 = new Thread() {
            public void run() {
                synchronized (resource2) {
                    System.out.println("Thread 2: locked resource 2");
                    try {
                        Thread.sleep(100);
                    }
                    catch (Exception e) {
                    }
                    synchronized (resource1) {
                        System.out.println("Thread 2: locked resource 1");
                    }
                }
            }
        }
        ;
        t1.start();
        t2.start();
    }
}
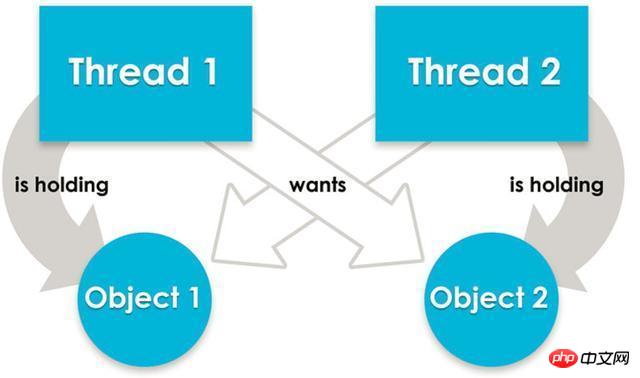
The application idea is very simple. Start two threads at the same time, lock resource1 and resource2 respectively, then sleep for 0.1 seconds, and then try to request resources resource2 and resource1 respectively.
Execute the application and enter the deadlock state after printing the following output on the console:
Thread 1: locked resource 1
Thread 2: locked resource 2
Use the command line jps -l -m to find the process ID of the application in deadlock state. From the figure below, we know that the deadlock process is 51476:

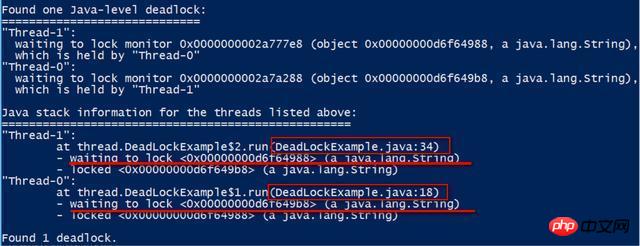
Then use the command line jstack 51476 to print the running stack information of this process.

The 0x00000000d6f64988 and 0x00000000d6f649b8 highlighted in red in my picture above represent the two resources "ABAP" and "Java" in the code.
The output printed by jstack is very clear, showing which line of Java code tried to lock which Java resource (waiting to lock in the picture below) but failed, and the reason for the failure was that it owned the current requested resource. The thread name is also printed.

With jstack, Java programmers no longer have to think hard about lengthy and brain-burning multi-threaded code. JDK will automatically print the cause of the deadlock. It's so convenient to come out.
The above is the detailed content of Use JDK's tool jstack to find out the cause of runtime program deadlock. For more information, please follow other related articles on the PHP Chinese website!

