
Home >Java >javaTutorial >Introduction to sql optimization for table queries in javaweb
Introduction to sql optimization for table queries in javaweb

- 不言forward
- 2018-10-12 14:35:282720browse
This article brings you an introduction to sql optimization for table queries in javaweb. It has certain reference value. Friends in need can refer to it. I hope it will be helpful to you.
Background
This SQL optimization is done for table queries in javaweb.
Partial network architecture diagram
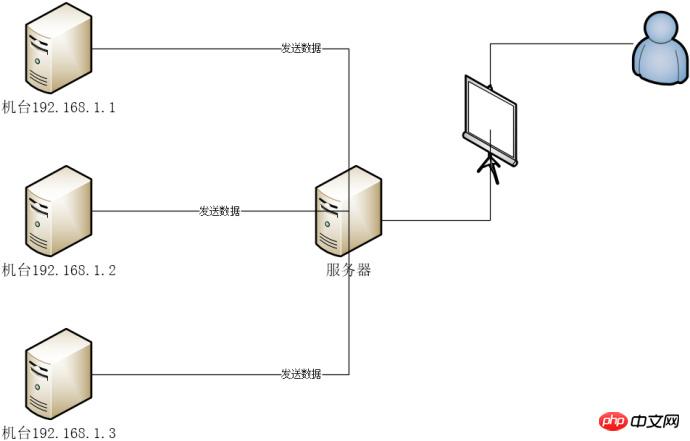
- windows single-machine master-slave separation
- has been divided into tables and databases, and the databases are divided by year. Talent table
- Each table contains about 200,000 data
- If you configure druid, you can directly view the sql execution time and uri request on the druid page Time
- Use System.currentTimeMillis in the background code to calculate the time difference.
- The sql splicing is too long, reaching 3000 rows, some even 8000 rows, most of them are union all operations, and there are unnecessary nested queries and unnecessary fields queried
- Use explain to view the execution plan , except for time, only one field in the where condition uses the index
- Decompose the union all operation, for example (a union all sql is also very long)
select aa from bb_2018_10_01 left join ... on .. left join .. on .. where ..
union all
select aa from bb_2018_10_02 left join ... on .. left join .. on .. where ..
union all
select aa from bb_2018_10_03 left join ... on .. left join .. on .. where ..
union all
select aa from bb_2018_10_04 left join ... on .. left join .. on .. where ..
Decompose the above sql into several sql for execution, and finally summarize the data. In the end, it is about 20 seconds faster.
select aa from bb_2018_10_01 left join ... on .. left join .. on .. where ..
select aa from bb_2018_10_02 left join ... on .. left join .. on .. where ..Execute the decomposed sql asynchronouslyUse java asynchronous programming operations , execute the decomposed sql asynchronously and finally summarize the data. CountDownLatch and ExecutorService are used here. The sample code is as follows:
   // 获取时间段所有天数
        List<String> days = MyDateUtils.getDays(requestParams.getStartTime(), requestParams.getEndTime());
        // 天数长度
        int length = days.size();
        // 初始化合并集合,并指定大小,防止数组越界
        List<你想要的数据类型> list = Lists.newArrayListWithCapacity(length);
        // 初始化线程池
        ExecutorService pool = Executors.newFixedThreadPool(length);
        // 初始化计数器
        CountDownLatch latch = new CountDownLatch(length);
        // 查询每天的时间并合并
        for (String day : days) {
            Map<String, Object> param = Maps.newHashMap();
            // param 组装查询条件

            pool.submit(new Runnable() {
                @Override
                public void run() {
                    try {
                        // mybatis查询sql
                        // 将结果汇总
                        list.addAll(查询结果);
                    } catch (Exception e) {
                        logger.error("getTime异常", e);
                    } finally {
                        latch.countDown();
                    }
                }
            });
        }


        try {
            // 等待所有查询结束
            latch.await();
        } catch (InterruptedException e) {
            e.printStackTrace();
        }

        // list为汇总集合
        // 如果有必要,可以组装下你想要的业务数据,计算什么的,如果没有就没了
The result is 20-30s fasterOptimize MySQL configurationThe following is an example of my configuration. Added skip-name-resolve, 4-5s faster. Other configurations are determined by yourself
[client]
port=3306
[mysql]
no-beep
default-character-set=utf8
[mysqld]
server-id=2
relay-log-index=slave-relay-bin.index
relay-log=slave-relay-bin
slave-skip-errors=all #跳过所有错误
skip-name-resolve

port=3306
datadir="D:/mysql-slave/data"
character-set-server=utf8
default-storage-engine=INNODB
sql-mode="STRICT_TRANS_TABLES,NO_AUTO_CREATE_USER,NO_ENGINE_SUBSTITUTION"

log-output=FILE
general-log=0
general_log_file="WINDOWS-8E8V2OD.log"
slow-query-log=1
slow_query_log_file="WINDOWS-8E8V2OD-slow.log"
long_query_time=10

# Binary Logging.
# log-bin

# Error Logging.
log-error="WINDOWS-8E8V2OD.err"


# 整个数据库最大连接(用户)数
max_connections=1000
# 每个客户端连接最大的错误允许数量
max_connect_errors=100
# 表描述符缓存大小,可减少文件打开/关闭次数
table_open_cache=2000
# 服务所能处理的请求包的最大大小以及服务所能处理的最大的请求大小(当与大的BLOB字段一起工作时相当必要)
# 每个连接独立的大小.大小动态增加
max_allowed_packet=64M
# 在排序发生时由每个线程分配
sort_buffer_size=8M
# 当全联合发生时,在每个线程中分配
join_buffer_size=8M
# cache中保留多少线程用于重用
thread_cache_size=128
# 此允许应用程序给予线程系统一个提示在同一时间给予渴望被运行的线程的数量.
thread_concurrency=64
# 查询缓存
query_cache_size=128M
# 只有小于此设定值的结果才会被缓冲
# 此设置用来保护查询缓冲,防止一个极大的结果集将其他所有的查询结果都覆盖
query_cache_limit=2M
# InnoDB使用一个缓冲池来保存索引和原始数据
# 这里你设置越大,你在存取表里面数据时所需要的磁盘I/O越少.
# 在一个独立使用的数据库服务器上,你可以设置这个变量到服务器物理内存大小的80%
# 不要设置过大,否则,由于物理内存的竞争可能导致操作系统的换页颠簸.
innodb_buffer_pool_size=1G
# 用来同步IO操作的IO线程的数量
# 此值在Unix下被硬编码为4,但是在Windows磁盘I/O可能在一个大数值下表现的更好.
innodb_read_io_threads=16
innodb_write_io_threads=16
# 在InnoDb核心内的允许线程数量.
# 最优值依赖于应用程序,硬件以及操作系统的调度方式.
# 过高的值可能导致线程的互斥颠簸.
innodb_thread_concurrency=9

# 0代表日志只大约每秒写入日志文件并且日志文件刷新到磁盘.
# 1 ,InnoDB会在每次提交后刷新(fsync)事务日志到磁盘上
# 2代表日志写入日志文件在每次提交后,但是日志文件只有大约每秒才会刷新到磁盘上
innodb_flush_log_at_trx_commit=2
# 用来缓冲日志数据的缓冲区的大小.
innodb_log_buffer_size=16M
# 在日志组中每个日志文件的大小.
innodb_log_file_size=48M
# 在日志组中的文件总数.
innodb_log_files_in_group=3
# 在被回滚前,一个InnoDB的事务应该等待一个锁被批准多久.
# InnoDB在其拥有的锁表中自动检测事务死锁并且回滚事务.
# 如果你使用 LOCK TABLES 指令, 或者在同样事务中使用除了InnoDB以外的其他事务安全的存储引擎
# 那么一个死锁可能发生而InnoDB无法注意到.
# 这种情况下这个timeout值对于解决这种问题就非常有帮助.
innodb_lock_wait_timeout=30
# 开启定时
event_scheduler=ON
According to the business, plus filtering conditionsQuickly 4-5sAdd the where condition Establishing a joint index for fields other than time conditions in the The effect is not that obviousUse the inner join method to associate the index conditions in the where conditionFor this, I I feel very surprised myself. The original sql, b is the index
select aa from bb_2018_10_02 left join ... on .. left join .. on .. where b = 'xxx'. There should be union all before, and union all is executed one by one, and the final summary result is obtained. Modified to
select aa from bb_2018_10_02 left join ... on .. left join .. on .. inner join
(
    select 'xxx1' as b2
    union all
    select 'xxx2' as b2
    union all
    select 'xxx3' as b2
    union all
    select 'xxx3' as b2
) t on b = t.b2
The result is 3-4s fasterPerformance bottleneckAccording to the above operation, the query efficiency has been improved in 3 days It reached about 8 seconds and couldn’t go any faster. The CPU usage and memory usage of MySQL are not very high. Why is the query so slow? The maximum number of data is 600,000 in 3 days. The data is related to some dictionary tables, so it is not like this. Continuing to rely on the information provided on the Internet, a series of sexy operations are basically useless and there is no way. Environment comparisonAfter analyzing the sql optimization, it is already ok. Just imagine if it is a disk read and write problem. Deploy the optimized programs in different on-site environments. One has ssd and one does not have ssd. It was found that the query efficiency was very different. After testing with software, it was found that the read and write speed of SSD is 700-800M/s, and the read and write speed of ordinary mechanical hard disk is 70-80M/s. Optimization results and conclusions
- Optimization results: meet expectations.
- Optimization conclusion: SQL optimization is not only the optimization of SQL itself, but also depends on its own hardware conditions, the impact of other applications, and the optimization of its own code.
Java Video Tutorial and Java Development Tutorial on the PHP Chinese website. Column! ! !
The above is the detailed content of Introduction to sql optimization for table queries in javaweb. For more information, please follow other related articles on the PHP Chinese website!
Statement:
This article is reproduced at:cnblogs.com. If there is any infringement, please contact admin@php.cn delete