Home >Operation and Maintenance >Linux Operation and Maintenance >How to query all related monitoring information of an ECS instance
How to query all related monitoring information of an ECS instance
- 坏嘻嘻Original
- 2018-09-26 15:43:342955browse
The content of this article is about how to query all related monitoring information of an ECS instance. It has certain reference value. Friends in need can refer to it. I hope it will be helpful to you.
DescribeInstanceMonitorData
Query all related monitoring information of an ECS instance. The returned monitoring content includes the CPU usage, received data traffic, sent data traffic, network traffic, and average bandwidth of the ECS instance. When some content is missing from the returned information, it may be because the system did not obtain the corresponding information, for example, the instance was in Stopped state at that time.
Description
When calling this interface, you need to pay attention:
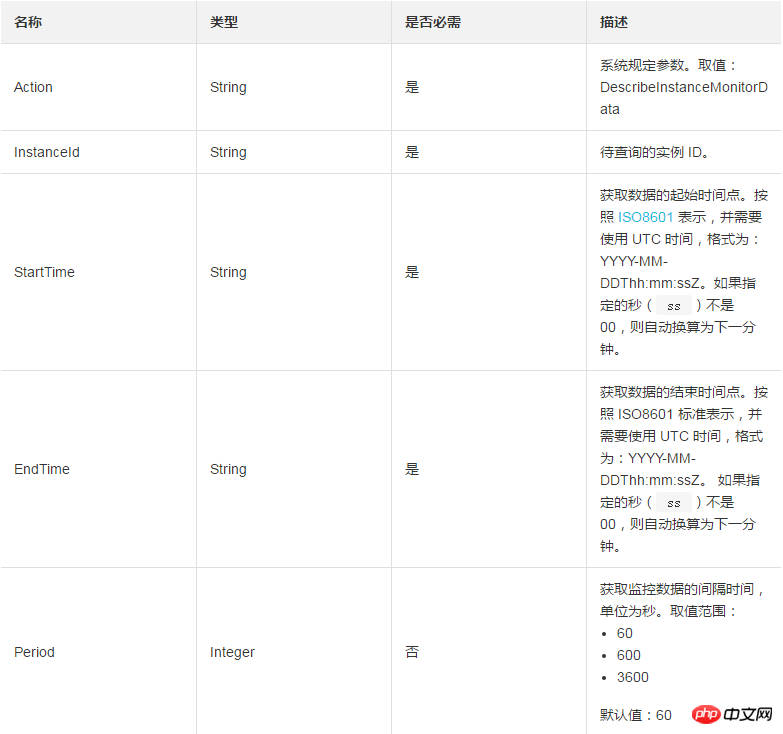
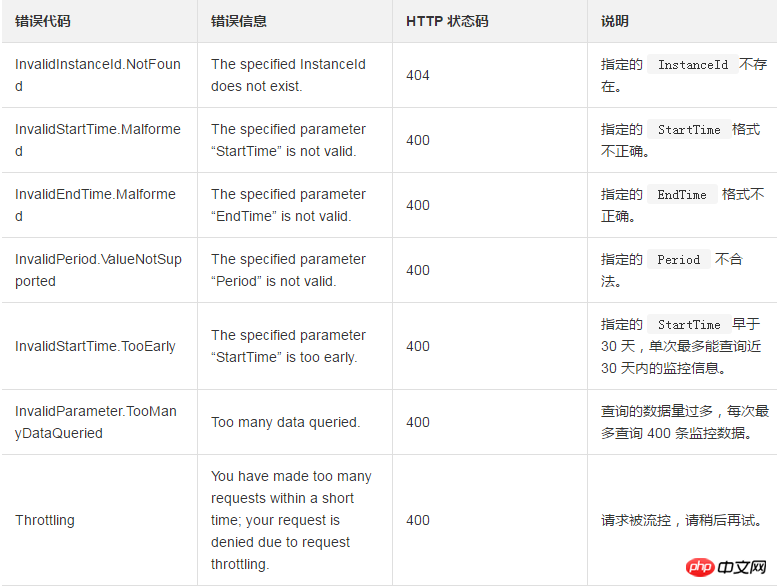
A maximum of 400 pieces of monitoring data can be returned each time. If When the specified parameter (EndTime StartTime)/Peroid > 400, an error will be returned.
Monitoring information within the past 30 days can be queried at most at a time. If the specified parameter StartTime exceeds 30 days, an error will be returned.
Request parameters

##Return parameters

Example
Request Example
https://ecs.aliyuncs.com/?Action=DescribeInstanceMonitorData
&InstanceId=i-instnace1
&StartTime=2014-10-29T23:00:00Z
&EndTime=2014-10-30T08:00:00Z
&<公共请求参数>
Return example
XML format
<DescribeInstanceMonitorDataResponse>
    <RequestId>C8B26B44-0189-443E-9816-D951F59623A9</RequestId>
    <MonitorData>
        <InstanceMonitorData>
            <InstanceId>Bc0102-23xYm09</InstanceId>
            <CPU>2</CPU>
            <IntranetRX>122</IntranetRX>
            <IntranetTX>343</IntranetTX>
            <IntranetFlow>675</IntranetFlow>
            <IntranetBandwidth>10</IntranetBandwidth>
            <InternetRX>122</InternetRX>
            <InternetTX>343</InternetTX>
            <InternetFlow>675</InternetFlow>
            <InternetBandwidth>10</InternetBandwidth>
            <IOPSRead>1000</IOPSRead>
            <IOPSWrite>200</IOPSWrite>
            <BPSRead>1000</BPSRead>
            <BPSWrite>200</BPSWrite>
            <TimeStamp>2010-01-21T09:50:23Z</TimeStamp>
        </InstanceMonitorData>
    </MonitorData>
</DescribeInstanceMonitorDataResponse>
JSON format
{
    "RequestId": "C8B26B44-0189-443E-9816-D951F59623A9",
    "MonitorData": {
        "InstanceMonitorData": [{
            "InstanceId": "Bc0102-23xYm09",
            "CPU": 0,
            "IntranetRX": 122,
            "IntranetTX": 343,
            "IntranetFlow": 675,
            "IntranetBandwidth": 10,
            "InternetRX": 122,
            "InternetTX": 343,
            "InternetFlow": 675,
            "InternetBandwidth": 10,
            "IOPSRead": 1000,
            "IOPSWrite": 200,
            "BPSRead": 1000,
            "BPSWrite": 200,
            "TimeStamp": "2010-01-21T09:50:23Z"
        }]
    }
}
Error code
The following are error codes unique to this interface. For more error codes, please visit the API Error Center.
The above is the detailed content of How to query all related monitoring information of an ECS instance. For more information, please follow other related articles on the PHP Chinese website!

