Home >Backend Development >PHP Tutorial >How to perform Xdebug breakpoint debugging in PHPStorm under laradock
How to perform Xdebug breakpoint debugging in PHPStorm under laradock
- 不言Original
- 2018-08-03 09:46:163340browse
This article introduces you to how to perform Xdebug breakpoint debugging in PHPStorm under laradock. It has a good reference value and I hope it can help friends in need.
laradock Configuration
Edit laradock/.env file
WORKSPACE_INSTALL_XDEBUG=true
PHP_FPM_INSTALL_XDEBUG=true
Rebuild the container
docker-compose build workspace php-fpm
# 启动
docker-compose up -d nginx mysql redi
PHPStorm Configuration
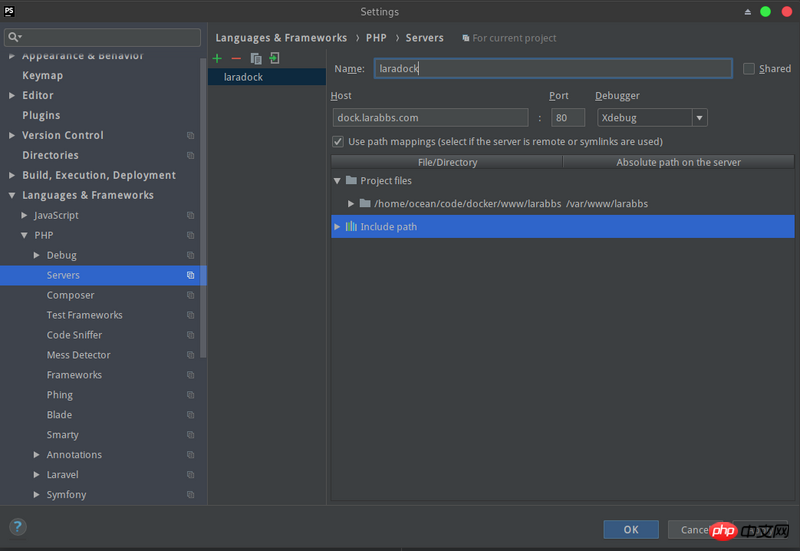
Open PHPStorm, File -> Settings and enter Languages & Frameworks -> PHP -> Servers. Create a new Server, as shown below
NameThe filled content must be the same as thelaradock/.envfileserverNameConsistent, the default islaradockHostis theHostaddress corresponding toserver;PortNo need to modify;DebuggerSelectXdebugSet directory mapping (
Use path mappings) ,Local directory->Remote directory
### Remote Interpreter ####################################

# Choose a Remote Interpreter entry matching name. Default is `laradock`
PHP_IDE_CONFIG=serverName=laradock

Set a breakpoint, click the phone button to start monitoring, and then you can perform breakpoint debugging


How to obtain video length and php.ini configuration in php
Introduction to the method of using arrays as parameters in php to optimize performance ( Code attached)
The above is the detailed content of How to perform Xdebug breakpoint debugging in PHPStorm under laradock. For more information, please follow other related articles on the PHP Chinese website!

